XM does not provide services to residents of the United States of America.

Technical Analysis

post-image

Technical Analysis – Silver bulls meet long-term trendline, but not ready yet to give up

Posted on July 3, 2020 at 10:34 am GMT

Silver attempted to break the upper border of the neutral zone it has been ranging within this week, but its efforts proved unsuccessful as the trendline joining the peaks from September 2019 defended the bears once again at 18.42. Hence, the short-run risk is looking neutral-to-positive at the moment and another retest of the soft downward-sloping trendline is likely. Particularly, a decisive close above the 18.65 barrier might be what the bulls are eagerly waiting for to rally towards the three-year [..]

post-image

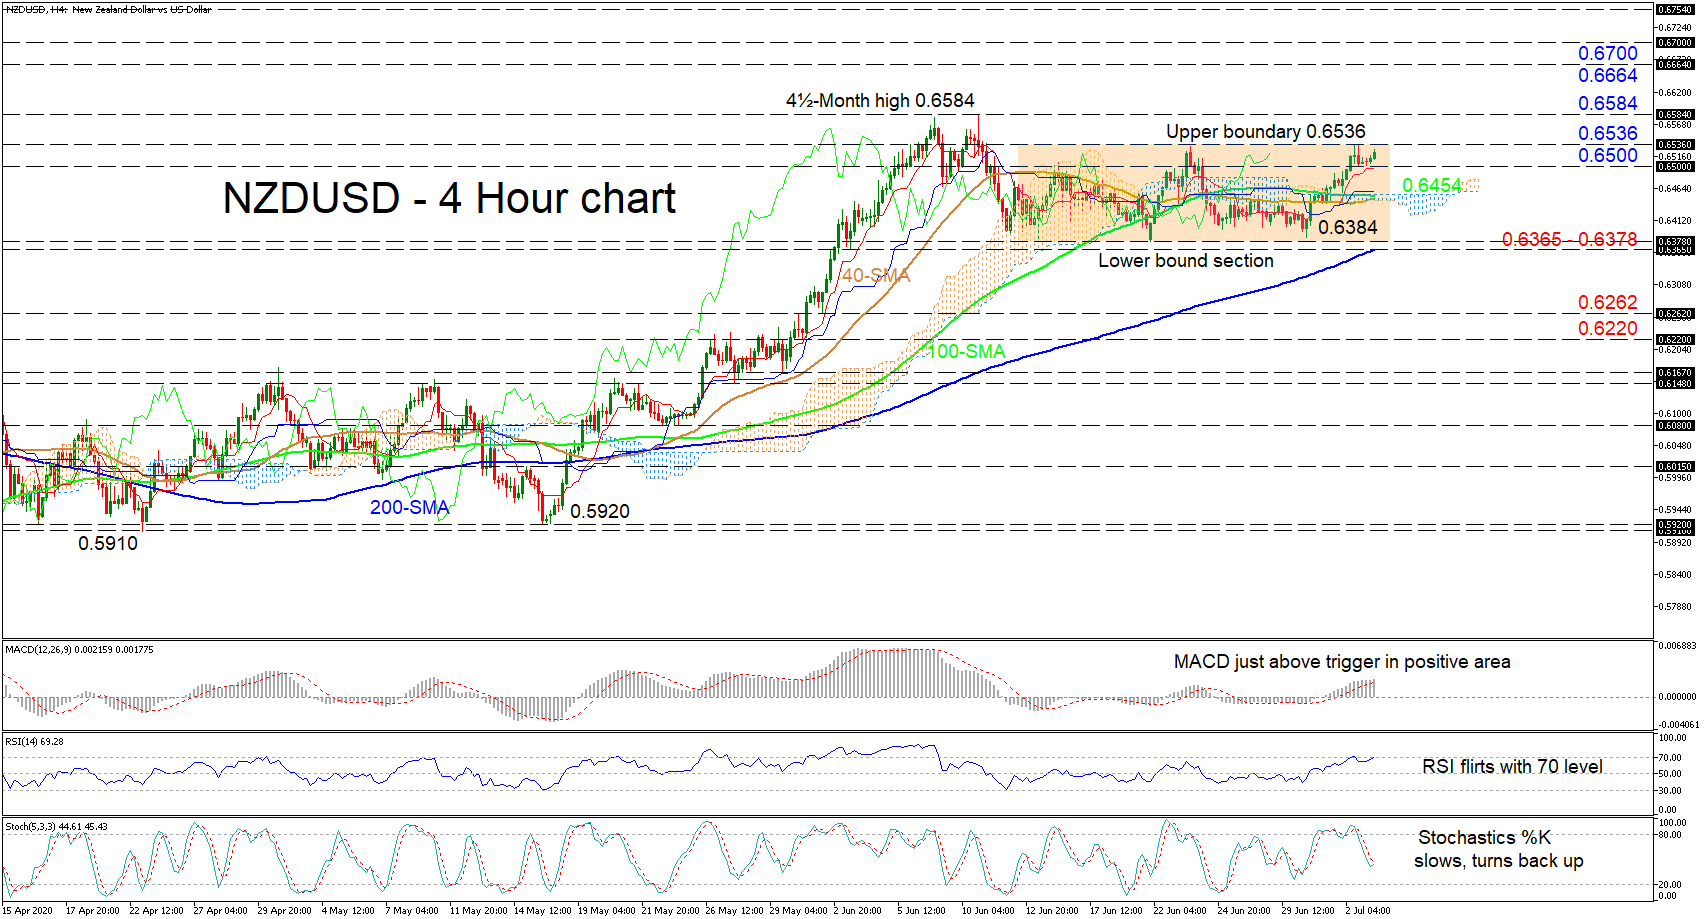
Technical Analysis – NZDUSD makes positive moves to retest ceiling of range

Posted on July 3, 2020 at 7:47 am GMT

NZDUSD recently overcame negative pressures jumping above the mostly flat 50- and 100-period simple moving averages (SMAs) and the neutral Ichimoku cloud to revisit the roof of the sideways market, which has held for around three weeks. Although currently stalled, this move is also reflected within the bullish Ichimoku lines. Furthermore, with positive momentum starting to pick up in the technical oscillators, the short-term picture is tilting more towards a positive outcome. The MACD, in the positive area and above [..]

Technical Analysis – USDCAD’s basic scenario is bearish, but eyes on nearby SMAs

Posted on July 3, 2020 at 7:35 am GMT

USDCAD bulls faded out near the descending trendline stretched from the top of 1.4667 in the last days of June, with the price slipping back to the 1.3500 zone. The downside correction, however, has not yet disturbed the short sequence of higher highs and higher lows started from the 1.3314 bottom. And should support around 1.3500 hold with the help of the 20- and 200-day simple moving averages (SMAs) in the same neighborhood, the pair may push harder to clear the [..]

Technical Analysis – GBPJPY finds obstacle at 100-day SMA; short-term outlook is bullish

Posted on July 3, 2020 at 7:26 am GMT

GBPJPY has found a strong resistance obstacle near the 38.2% Fibonacci retracement level of the up leg from 124.00 to 139.80 at 133.70, where the 20- and 100-day simple moving averages (SMAs) reside too. The recent rebound on the short-term ascending trend line drove the stochastic oscillator towards overbought conditions, suggesting a possible pullback in the market, however, the RSI is flattening near the 50-neutral threshold. To the upside, emanating pressure over the last couple of days has denied upside [..]

post-image

Technical Analysis – Copper futures crawl near 6-month high; indicators seem overbough

Posted on July 2, 2020 at 12:46 pm GMT

Copper is trading around the vicinity of the six-month top of 2.7644, achieved earlier today, continuing the buying interest that started on March 19. Looking at the short-term oscillators, the stochastic and the RSI signal a slight decrease around their overbought marks as they are losing momentum. However, the MACD oscillator is still showing some improvements above its trigger line. Should buyers drive above the six-month peak of 2.7644, they could encounter initial strengthened resistance from the 2.8800 barrier, taken [..]

post-image

Technical Analysis – US 100 index is greedy for more all-time highs

Posted on July 2, 2020 at 12:24 pm GMT

The US 100 stock index (cash) is calling new all-time highs ahead of the Nonfarm payrolls report due later today as the price has yet to reach the edge of the overbought zone in the daily chart; the RSI has yet to peak above 70 and the Stochastics keep strengthening towards the 80 level. The next stop could be near the 10,650 level taken from the 161.8% Fibonacci extension of the latest negative correction (from 10,346 to 9,820). Alternatively, the [..]

post-image

Technical Analysis – GBPAUD stands near 9-month trough; remains in bearish mode

Posted on July 2, 2020 at 11:39 am GMT

GBPAUD has been heading considerably lower over the last four months, touching a new nine-month low of 1.7860. Currently, the price is edging slightly higher, approaching the 20-day simple moving average (SMA) and the MACD oscillator is moving above its trigger line. Also, the RSI is ticking up in the negative territory, suggesting a potential pullback. A rally above the 20-day SMA could challenge the 40-day SMA near 1.8363 and the 1.8430 resistance. Slightly higher, the 23.6% Fibonacci retracement level [..]

post-image

Technical Analysis – CHI 50 stock index accelerates to 2020 highs

Posted on July 2, 2020 at 11:13 am GMT

China’s 50 stock index (cash) is recording another stunning green day, rallying by more than 5% since the latest rebound on the 20-day simple moving average (SMA) to re-challenge the 2020 high of 14,678. The sharp move drove the pair to overbought territory according to the RSI, which pierced above 70. However, the indicator has yet to reverse lower and the stochastics seem ready to return above 80, so the rally may still have some fuel to burn. Above the [..]

post-image

Technical Analysis – EURJPY cautiously positive above SMAs

Posted on July 2, 2020 at 10:15 am GMT

EURJPY appears somewhat optimistic despite the recent consolidation in price above the 200-period simple moving average (SMA). Positive signals include the price having moved above the SMAs and the Ichimoku cloud, while the Ichimoku lines stall their positive tone. Furthermore, a nearing bullish crossover of the 100-period SMA by the 50-period one could boost positive sentiment too. Additionally, the oscillators are leaning slightly towards a positive outcome in the short-term, despite paused positive momentum. The MACD, in the positive region, [..]

Technical Analysis – WTI futures weaken their bullish move above SMAs

Posted on July 2, 2020 at 7:55 am GMT

WTI crude oil futures have found resistance at the 41.60 barrier, sending prices sideways in the short-term. Oil is keeping its position above the moving averages despite the contradicting signals in the momentum indicators. The MACD is holding beneath its trigger line in the positive territory, while the RSI is pointing marginally up in the bullish region. In case of more upside pressures and a successful climb above the immediate resistance of 41.60, the next hurdle would come from the 61.8% Fibonacci retracement level of [..]

Risk Warning: Your capital is at risk. Leveraged products may not be suitable for everyone. Please consider our Risk Disclosure.