XM does not provide services to residents of the United States of America.

Technical Analysis

Technical Analysis – EURGBP closes below trendline; bearish bias still weak

Posted on July 8, 2020 at 7:39 am GMT

EURGBP slipped below the 20-day simple moving average (SMA) on Tuesday and closed marginally below the ascending trendline that has been strictly supporting the market since the sharp rebound in mid-February. Another negative close below that line could strengthen warnings that the weakness in the price may persist, confirming the somewhat discouraging signal the falling RSI is currently providing. To the downside, the 50-day SMA and the lower Bollinger band, both around 0.8930, may prove to be game changers if they [..]

Technical Analysis – USDJPY remains in horizontal trajectory; directional signals weak

Posted on July 8, 2020 at 7:15 am GMT

USDJPY’s fixed course continues to edge sideways below the steady 200-day simple moving average (SMA), squeezed by the upper and mid-Bollinger bands. The convergence in the 50- and 100-day SMAs and their flattening tone suggest that the current path may endure a while longer. Looking at the short-term oscillators, directional momentum is non-existent. The MACD is at its zero mark barely above its red signal line, while the RSI is marginally hovering above the 50 threshold. In the positive scenario, [..]

post-image

Technical Analysis – Gold trades around almost 9-year peak near 1,800

Posted on July 8, 2020 at 7:13 am GMT

Gold surged to an almost nine-year peak of 1,797 on Tuesday’s session, retaining the strong bullish structure. Currently, the price is holding well above the simple moving averages (SMAs) and the Ichimoku cloud in the 4-hour chart. However, looking at the short-term technical indicators, the RSI is moving sideways slightly below the 70 level, while the MACD, still above its trigger line, is losing momentum, suggesting a possible downside retracement. If the yellow metal has a successful attempt above the [..]

post-image

Technical Analysis – GBPCHF’s positive pressures attempt to halt the decline

Posted on July 7, 2020 at 2:58 pm GMT

GBPCHF seems to have found a foothold on the 1.1760 level, that being the 38.2% Fibonacci retracement of the down leg from 1.2819 to the all-time low of 1.1109. The recent appreciation in price appears to have backing from the short-term oscillators, which could extend it towards the downward sloping 50- and 100-day simple moving averages (SMAs). The MACD, in the negative region, has moved above its red trigger line, while the RSI has pushed over the 50 threshold. In [..]

post-image

Technical Analysis – USDCNH plunges to new 4-month low

Posted on July 7, 2020 at 2:22 pm GMT

USDCNH plummeted to a fresh four-month low of 6.9947 earlier today after the strong bearish rally on Monday. The market is in the process to cover some of the losses, approaching the 50.0% Fibonacci retracement level of the up leg from 6.8433 to 7.1944 at 7.0201 again. The momentum indicators are contradicting each other as the RSI is rebounding on the oversold region, while the MACD is declining beneath its trigger line in the near term. Also, the 20- and [..]

post-image

Technical Analysis – EURCHF’s pullback adopts a sideways bearing

Posted on July 7, 2020 at 11:43 am GMT

EURCHF appears to be crawling sideways in the latest sessions, after the plunge from the 1.0914 high reversed ahead of the horizontal 100-day simple moving average (SMA), currently at 1.0606. The MACD and the RSI are not signalling any strong directional moves as they both hover slightly below their neutral marks. Additionally, the mostly flattened 100-and 200-day SMAs indicate the weakness in price in setting a stronger course for now. However, the rising 50-day SMA promotes some strength in the [..]

post-image

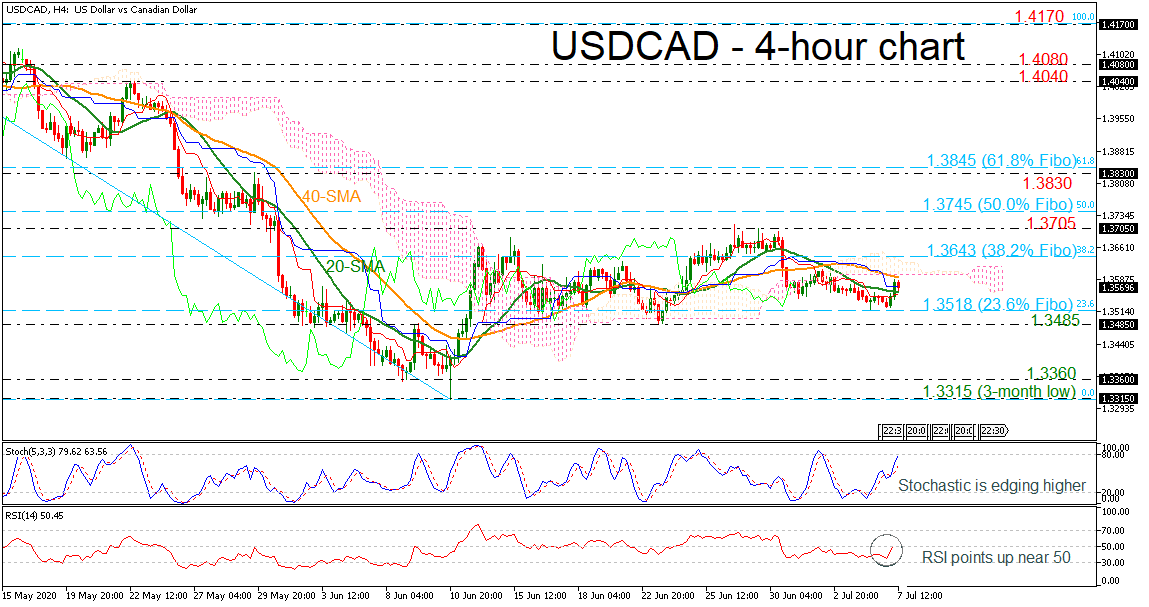
Technical Analysis – USDCAD sustains neutral picture; indicators suggest bullish move

Posted on July 7, 2020 at 11:38 am GMT

USDCAD rebounded on the significant 23.6% Fibonacci retracement level of the down leg from 1.4170 to 1.3315 at 1.3518, trying to erase some losses in the very short-term. The upside tendency in the technical indicators are giving some optimism for fresh gains. The stochastic is moving towards the overbought territory, while the RSI is touching the 50 level with strong momentum. Should buyers drive above the 40-period simple moving average (SMA) at 1.3592, they could encounter initial strengthened resistance from [..]

Technical Analysis – EURJPY bulls keep the lead; need to clear 122.00 first

Posted on July 7, 2020 at 7:24 am GMT

EURJPY has been showing full compliance to the supportive ascending trendline since the rebound near the 200-day simple moving average (SMA), with the price rising as high as 121.95 on Monday. While there is still some way to go towards June’s peak of 124.42, the momentum indicators suggest that the bulls may not give up efforts in the short-term; the RSI is comfortably strengthening above its 50 neutral mark, while the MACD, within the positive area, is ready to move [..]

post-image

Technical Analysis – WTI futures hold slightly bullish in short term

Posted on July 7, 2020 at 7:02 am GMT

WTI crude oil futures are in a positive movement since June 25, however, the RSI indicator points lower. Currently, the market is heading beneath the mid-level of the Bollinger band and the MACD oscillator slipped under its trigger line in the 4-hour chart. A continuation of the negative move could see immediate support come from the lower Bollinger band which overlaps with the 40-period simple moving average (SMA) at 39.72, before flirting with the 23.6% Fibonacci retracement level of the upward move from 30.57 to 41.61 at 38.93. [..]

Technical Analysis – GBPUSD’s positive drive wanes, directional pressures disappear

Posted on July 7, 2020 at 6:35 am GMT

GBPUSD’s lack of momentum has frozen the pair around the mid-Bollinger band and above the 1.2462 mark, that being the 50.0% Fibonacci retracement of the down leg from 1.3514 to 1.1410. Despite the recent improvement from the lower Bollinger band, the short-term oscillators reflect a state of evaporated directional momentum. The MACD and its red trigger line are flat at the zero mark, while the RSI is hovering marginally above the 50 threshold. The stochastic lines have stalled just above [..]

Risk Warning: Your capital is at risk. Leveraged products may not be suitable for everyone. Please consider our Risk Disclosure.