XM does not provide services to residents of the United States of America.

Technical Analysis

post-image

Technical Analysis – GER 30 index stalls appreciation above SMAs; momentum slows    

Posted on July 13, 2020 at 3:26 pm GMT

Germany 30 Index (Cash) seems skewed to the upside as the price has moved above the rising simple moving averages (SMAs) and the Ichimoku cloud. Although the sideways market looks to be tipping towards the upside, it is currently on weak positive momentum, something also reflected in the Ichimoku lines and the short-term oscillators. The MACD, is holding above its red trigger line in the positive area with weak momentum, while the RSI gradually points higher in the positive region. [..]

post-image

Technical Analysis – AUDUSD still consolidating; unable to break above upper channel

Posted on July 13, 2020 at 12:33 pm GMT

AUDUSD has been consolidating since June 16 and has been stuck in a channel tilted slightly to the upside. The neutral to bullish picture in the short term looks to last for a while longer after prices failed to break above the upper channel earlier this month. Resistance was met at around the 0.7000 psychological region after prices surpassed the simple moving averages (SMAs) and the Ichimoku cloud. The slightly bullish bias in the near term is supported by the [..]

post-image

Technical Analysis – US 500 index creeps higher; intentions appear positive

Posted on July 13, 2020 at 12:29 pm GMT

US 500 stock index (Cash) recently displayed a positive objective after finding a foothold on the 100-period simple moving average (SMA) and the upper surface of the Ichimoku cloud. The one-month neutral-to-bullish picture seems to have gained backing from the climbing SMAs and the recent bullish crossover by the 50-period SMA. Adding to this view are the positive signals reflected in the short-term oscillators. The MACD, in the positive region, is increasing above its red trigger line, while the RSI [..]

post-image

Technical Analysis – USDJPY attempts to meet mid-Bollinger band; neutral bias

Posted on July 13, 2020 at 10:32 am GMT

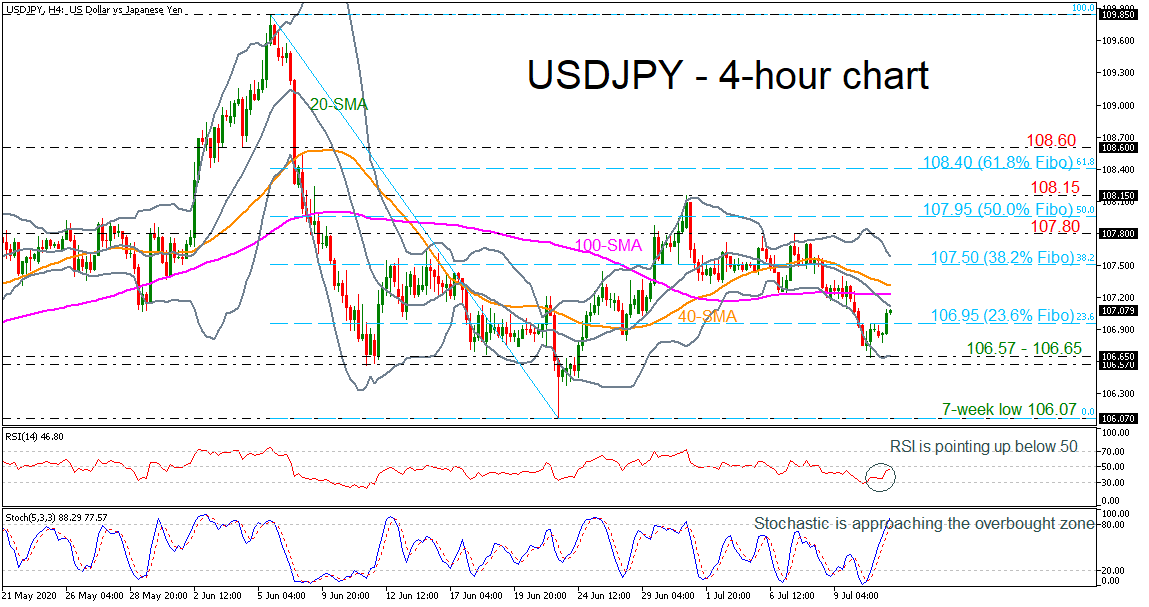
USDJPY produces an upward attempt above the 23.6% Fibonacci retracement level of the down leg from 109.85 to 106.07 at 106.95, turning the momentum indicators to the upside. Technically, the stochastic oscillator is heading north in the overbought zone, while the RSI is pointing higher in the negative territory. However, the moving averages are sloping down with the mid-level of the Bollinger band creating a negative cross with the 100-period simple moving average (SMA) in the very short-term. More upside [..]

Technical Analysis – Gold seems unstoppable, positive direction intact

Posted on July 13, 2020 at 7:46 am GMT

Gold maintains a healthy bullish bearing despite having slightly pulled back after plotting a fresh more than 8½-year high of 1,817.89. The pair’s retreat from the upper Bollinger band is also reflected in the stochastic oscillator, which displays some weakening in positive momentum, as the %K line completed a bearish crossover of the %D line, dipping from the overbought region. Nevertheless, the predominant positive charge in the simple moving averages (SMAs) suggests a well-defined course northwards. Moreover, the MACD and [..]

Technical Analysis – EURUSD fails to increase bullish bias; indicators are weak

Posted on July 13, 2020 at 6:59 am GMT

EURUSD has been trading sideways over the last month failing to improve the bullish rally that started from the 1.0870 support. Currently, the pair is standing above the 20-day simple moving average (SMA), however, the red Tenkan-sen line dropped beneath the blue Kijun-sen line, suggesting a possible downside retracement. Looking at the momentum indicators, the MACD is hovering near the trigger line in the positive region, while the RSI is marginally sloping up above the 50 level in the short-term [..]

post-image

Technical Analysis – NZDUSD attempts to restore positive sentiment

Posted on July 10, 2020 at 10:57 am GMT

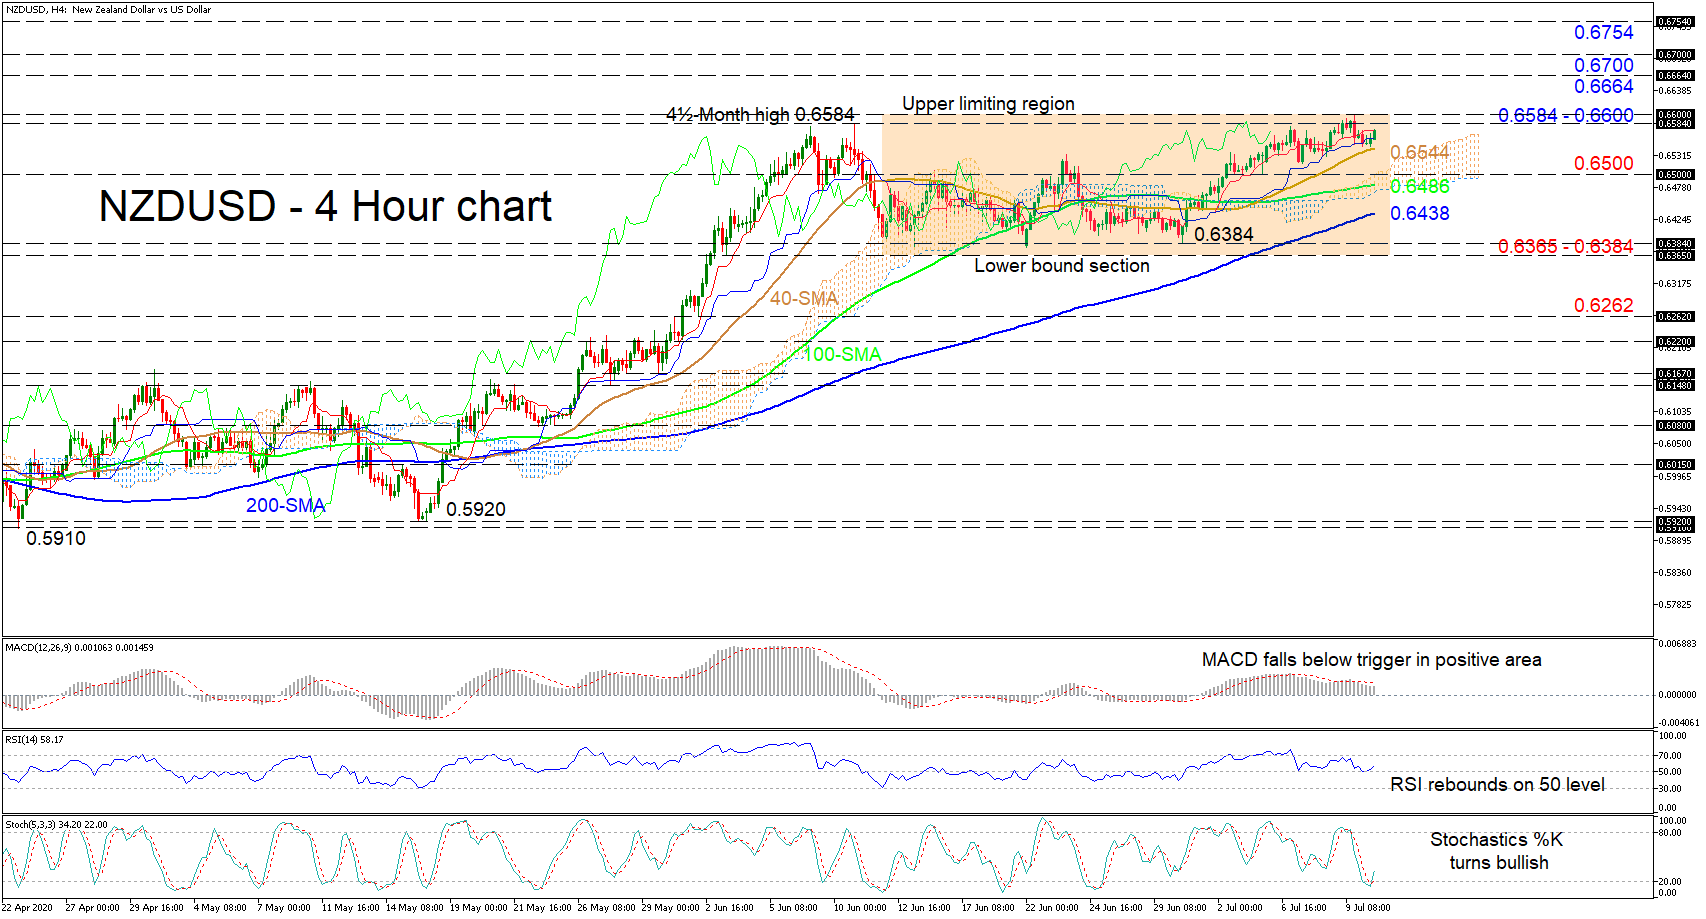
NZDUSD appears to be strengthening after finding a footing on the 40-period simple moving average (SMA), which may enhance the very short-term neutral-to-bullish picture. Although the positive momentum in the MACD and the Ichimoku lines has stalled, the rising SMAs, RSI and stochastic oscillator endorse further gains. The RSI is improving after bouncing on the 50 threshold, while the %K line has completed a bullish crossover out of oversold territory, promoting advances. If buying interest intensifies, early resistance may develop [..]

post-image

Technical Analysis – US 30 index loses momentum in short term

Posted on July 10, 2020 at 10:14 am GMT

The US 30 cash index has been on the sidelines over the last month as the 26,410 resistance level seems to be a real struggle for the bulls. Technically, the price could lose some ground in the short-term as the MACD is changing direction to the downside below the zero line, while the RSI is holding beneath the neutral threshold of 50 but is pointing up. A rebound on the 25,560 support and a rise above the simple moving averages (SMAs) could [..]

post-image

Technical Analysis – GBPUSD tumbles after touching 3-month high

Posted on July 10, 2020 at 7:24 am GMT

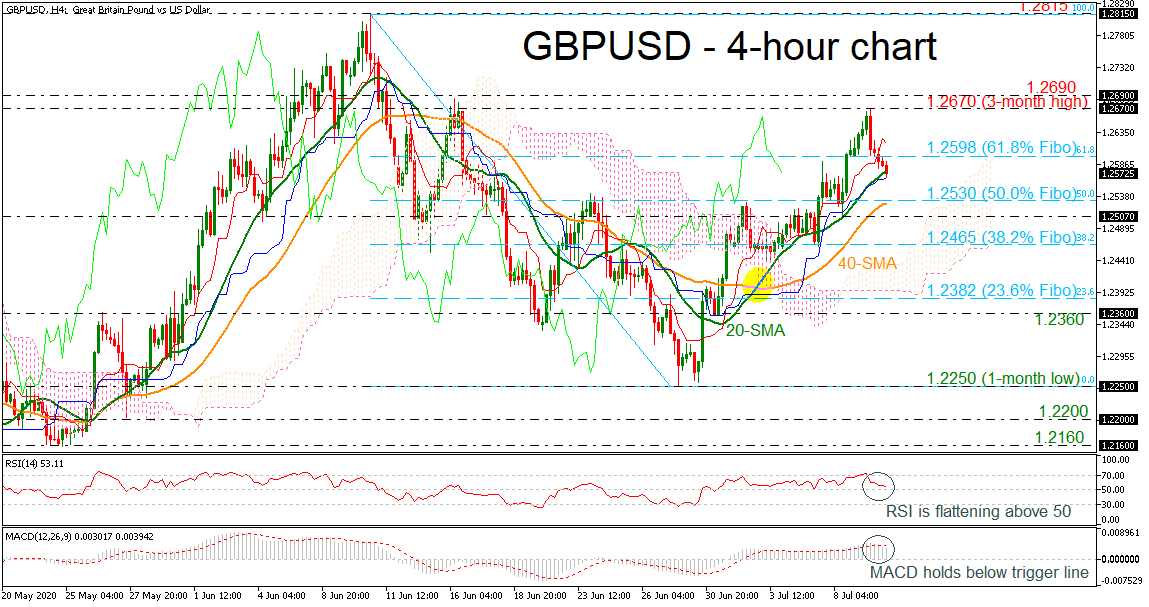
GBPUSD has been in an ascending move after the rebound on the 1.2250 trough, touching a new three-month high of 1.2670. The price is currently testing the 20-day simple moving average (SMA), while the RSI indicator is pointing slightly down near the 50 level. Also, the MACD is losing momentum beneath its trigger line but it still hovering above the zero line. An extension of the downside movement could hit the 50.0% Fibonacci retracement level of the up leg from [..]

Technical Analysis – USDCAD confronts downtrend line fortified by 40-day SMA

Posted on July 10, 2020 at 7:23 am GMT

USDCAD is currently tackling the downtrend line drawn from the 50-month high of 1.4667 achieved on March 19, aligned with the falling 40-day simple moving average (SMA).  Further hindrance is arising from the overlapping 1.3633 level, that being the 23.6% Fibonacci retracement of the down leg from 1.4667 to 1.3314. The bulls seem to have backing from the oscillators that reflect improving positive momentum in the near-term. The MACD, in the negative region, holds above its red trigger line near [..]

Risk Warning: Your capital is at risk. Leveraged products may not be suitable for everyone. Please consider our Risk Disclosure.