XM does not provide services to residents of the United States of America.

Technical Analysis

post-image

Technical Analysis – GBPJPY takes a breather; positive picture intact

Posted on August 5, 2020 at 2:14 pm GMT

GBPJPY looks to have consolidated somewhat after plotting a near two-month high of 139.19, although it has managed to maintain a positive tone. This view is also endorsed by the rising simple moving averages (SMAs) and the positive bearing of the Ichimoku lines. The short-term oscillators further suggest that positive momentum is strengthening and promote additional improvements in price. The MACD, in the positive region, although below its red signal line is looking to reclaim it, while the RSI is [..]

Technical Analysis – USDJPY downside risks endure under SMAs and diagonal line

Posted on August 5, 2020 at 7:50 am GMT

USDJPY is following a downward trajectory despite efforts to recoup recent losses, mirrored in the stalled blue Kijun-sen line and the improvement in the MACD oscillator. The negative direction appears to persist backed by the gradual declining simple moving averages (SMAs) and the unbroken bearish tone of the Ichimoku lines, with a falling red Tenkan-sen line. The MACD, in the negative region, has pushed above its red trigger line while the RSI slowly glides lower in bearish territory. To the [..]

Technical Analysis – EURGBP halts decline below trendline

Posted on August 5, 2020 at 7:12 am GMT

EURGBP could not sustain strength above the ascending trendline that seems to have adopted a resistance role following its downside violation, with the price retreating slightly below the 0.9000 level on Monday. The 38.2% Fibonacci of the 0.9497-0.8670 downleg came immediately to the rescue thereafter, helping the pair to rebound near 0.8980 and hold above its previous low of 0.8937, a break of which would raise concerns about the short-term upward pattern. From a technical perspective, the short-term bias is [..]

post-image

Technical Analysis – USDCAD edges sideways near 2-month bottom levels

Posted on August 4, 2020 at 3:19 pm GMT

USDCAD appears to have adopted a neutral nature around the lower levels of the last two months, confined between 1.3330 and 1.3459. The flattening out of the 50-period simple moving average (SMA) and the Ichimoku lines further reflect this view of weak directional momentum. The short-term oscillators suggest conflicting signals of momentum. Although the RSI points downwards under the 50 threshold, the stochastic oscillator is bullish, coming out of the oversold region. Adding to this, the MACD and red signal [..]

post-image

Technical Analysis – EURCHF stalls above 200-day SMA as negative tensions grow

Posted on August 4, 2020 at 1:20 pm GMT

EURCHF remains confined between 1.0837 and 1.0733 as it consolidates above the 200-day simple moving average (SMA), something also reflected in the flattened Ichimoku lines and cloud. The pair’s recent weakening in this section is further mirrored in the short-term oscillators. The MACD, some distance in the positive region, has dipped below its red signal line, while the RSI is decreasing towards the 50 threshold. Moreover, the stochastic oscillator has turned negative with weak momentum. Nevertheless, the positive bearing of [..]

Technical Analysis – GBPUSD gains take a blow; positive signals relatively intact

Posted on August 4, 2020 at 7:31 am GMT

GBPUSD hit a snag after its recent appreciation reached a near five-month high of 1.3169, slightly below a significant resistance at the 1.3200 level. The minor retreat in price is mirrored in the reduced bullish slopes of the Ichimoku lines and the bearish orientation of the stochastic oscillator around the 80 level. That said, the MACD and RSI maintain a paused positive demeanour, while the rising 50- and 100-day simple moving averages (SMAs) uphold a positive charge. The MACD, deep [..]

Technical Analysis – EURJPY bulls battling against 200-weekly SMA

Posted on August 4, 2020 at 7:29 am GMT

EURJPY had another constructive week thanks to the ascending trendline that provided strong protection against downside pressures, helping the price to rally towards a 15-month high of 125.19 on Friday. Despite that, the pair could not successfully claim the 125.00 mark as the 200-period simple moving average (SMA) in the weekly chart is blocking the way higher at the same location. Hence, there are some doubts about whether the pair can overcome that line and speed up towards the familiar [..]

post-image

Technical Analysis – AUDUSD uncovers footing at lower surface of Ichimoku cloud

Posted on August 3, 2020 at 3:27 pm GMT

AUDUSD seems to have found a foothold around the fortified 0.7063 trough. Reinforcing this area is the lower surface of the Ichimoku cloud and the 100-period simple moving average (SMA). Currently, the falling Ichimoku lines are reflecting weakness in positive momentum as are the short-term oscillators. That said, the red Tenkan-sen line has yet to complete a negative overlap of its blue Kijun-sen line. Moreover, the RSI is pointing upwards in the bearish zone, while the MACD is holding slightly [..]

post-image

Technical Analysis – US 500 index struggles to maintain positive picture around 5-month high

Posted on August 3, 2020 at 12:23 pm GMT

US 500 index (Cash) is encountering strong resistance around the recent five-month high of 3,292.24. The price appears to have somewhat stalled for now, something also suggested by the flattened Ichimoku lines. The short-term oscillators further reflect the pause in positive momentum. The MACD, in the positive region, continues to float just below its horizontal red trigger line while the RSI is holding in bullish territory. Additionally, the stochastic lines are rising in overbought territory, the RSI is pointing slightly [..]

post-image

Technical Analysis – USDJPY gives up gains after quick rebound

Posted on August 3, 2020 at 9:43 am GMT

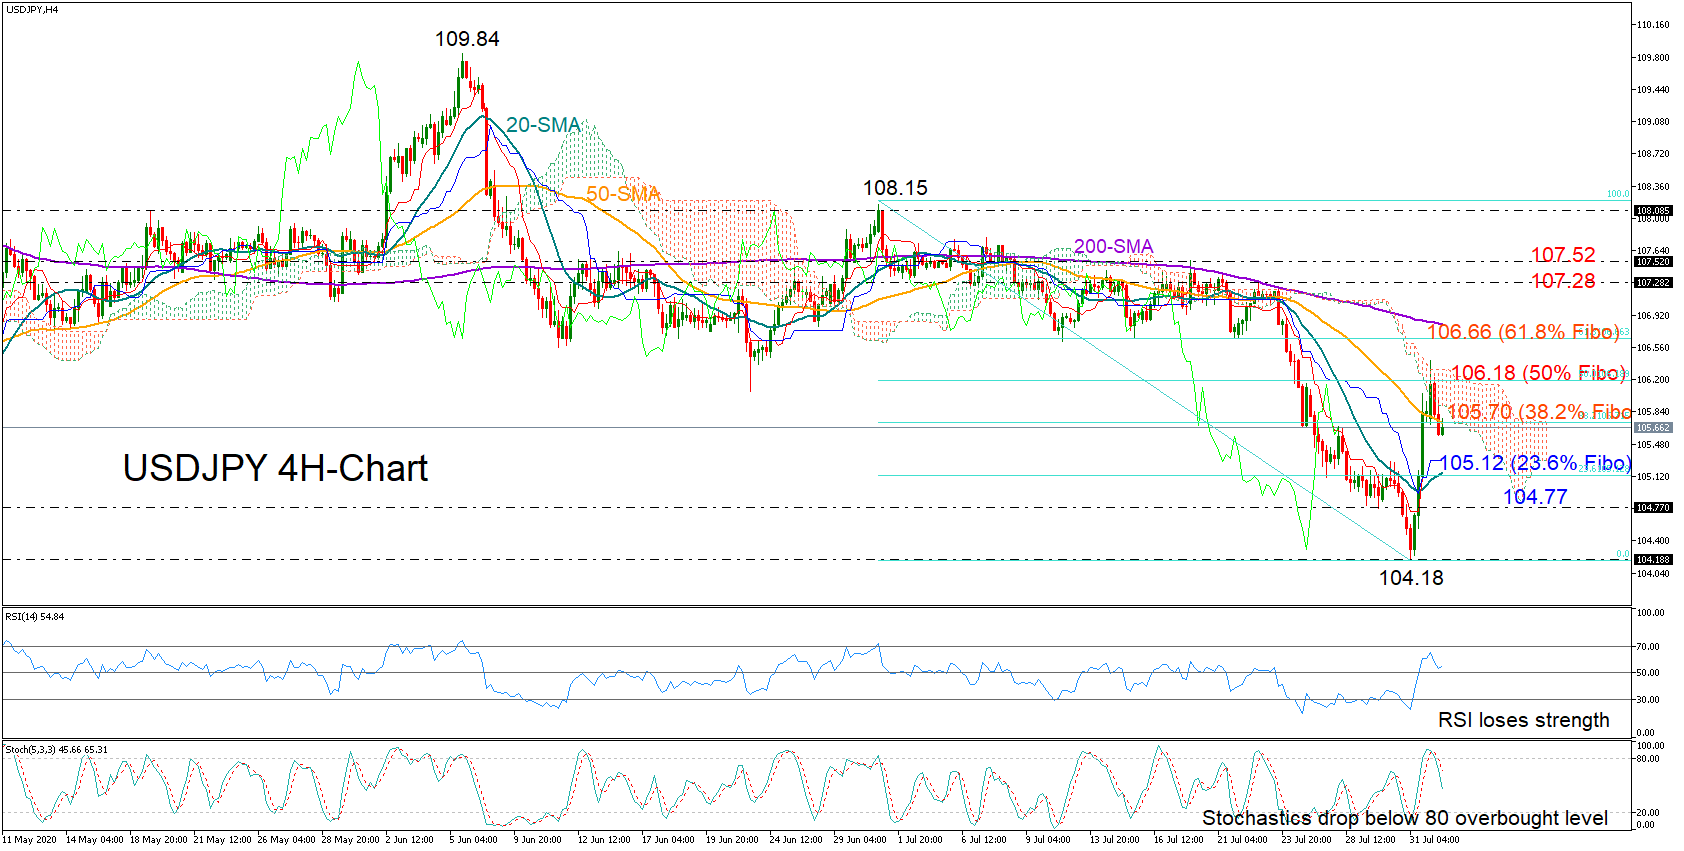
USDJPY hit a bottom at 104.18 and bounced aggressively towards the 106.00 area in an attempt to return to its previous range. The price, however, could not sustain gains above that level, retracing back to the 105.00 territory instead. The 38.2% Fibonacci of the 108.15-104.18 downleg at 105.70 could not successfully block the way to the downside either despite restricting it earlier in the day, and the pair is currently looking exposed to the 23.6% Fibonacci of 105.12 and the [..]

Risk Warning: Your capital is at risk. Leveraged products may not be suitable for everyone. Please consider our Risk Disclosure.