XM does not provide services to residents of the United States of America.

Technical Analysis

Technical Analysis – EURJPY retreats beneath 16-month high; bullish outlook

Posted on August 11, 2020 at 7:09 am GMT

EURJPY has been underperforming in the past two days, testing the red Tenkan-sen line. When looking at the bigger picture the pair has been in a clear bullish tendency since May 6. On the daily chart, prices bounced off the 16-month high of 125.60 but based on the technical indicators, momentum is weakening for a further move higher. The RSI indicator is flattening in the positive region, while the MACD slipped beneath the trigger line above the zero level. If [..]

post-image

Technical Analysis – AUDNZD set to confirm a bullish inverse head and shoulder pattern

Posted on August 10, 2020 at 3:57 pm GMT

AUDNZD is again desperately looking to break above the 1.0870 resistance area that has been holding for more than a year now. Slightly higher, the 23.6% Fibonacci retracement level of the 2011-2020 downtrend at 1.0883 is adding extra importance to the region as it looks to be the neckline of a bullish inverse head and shoulder pattern. Should the bulls breach that neckline, the rally may accelerate towards the 1.0970-1.1015 zone which has been a key barrier to upside movements [..]

post-image

Technical Analysis – GBPNZD cautiously positive; gains meet significant strain

Posted on August 10, 2020 at 3:17 pm GMT

GBPNZD is tackling the capping 100-day simple moving average (SMA) at 1.9880 at the ceiling of the Ichimoku cloud. The bullish demeanour of the Ichimoku lines look to be aiding the price’s recent ascent from 1.9000, which has so far recouped some losses of a three-month deterioration. The short-term oscillators also reflect the improvement in positive momentum. The MACD, in the positive section, is increasing above its red trigger line as the RSI sneaks into overbought territory. Moreover, the stochastic [..]

post-image

Technical Analysis – EURCHF remains range bound despite slight appreciation

Posted on August 10, 2020 at 1:18 pm GMT

EURCHF is still trading within the boundaries of 1.0711 and 1.0837 without directional momentum. This is reflected in the zig zagging Ichimoku lines and gradually diminishing slopes of the 50- and 100-period simple moving averages (SMAs), as they all converge to a somewhat horizontal state. The pair’s latest push higher is mirrored in the rising RSI, which peeked above the 50 threshold, and the increasing stochastic lines from the oversold territory. Nevertheless, the lack of momentum reflected in the flattened [..]

post-image

Technical Analysis – AUDUSD seems ready to test uptrend line

Posted on August 10, 2020 at 1:15 pm GMT

AUDUSD completed a double top formation around the 0.7243 resistance level and dropped beneath the 0.7174 resistance and the 40-period simple moving average (SMA). However, the price found strong support at the 23.6% Fibonacci retracement level of the up leg from 0.6830 to 0.7243 at 0.7146 and the Ichimoku cloud. Technically, the RSI indicator is flattening below the 50 level and the MACD oscillator dropped beneath the trigger line and the zero level. The 20- and 40-period SMAs are sloping [..]

post-image

Technical Analysis – US 500 index preserves positive objectives

Posted on August 10, 2020 at 9:33 am GMT

US 500 stock index (Cash) seems to be aiming its course towards unfamiliar territory above the all-time high of 3,396.64. The price has been steadily heading higher after finding traction again at the 100-period simple moving average (SMA) and the Ichimoku cloud in previous sessions. Aiding this progression from the 2,995 level are the advancing Ichimoku lines and the positive bearing in the SMAs. That said, the index’s positive momentum has weakened slightly as suggested in the short-term oscillators. The [..]

post-image

Technical Analysis – USDJPY fails to improve positive picture

Posted on August 10, 2020 at 8:46 am GMT

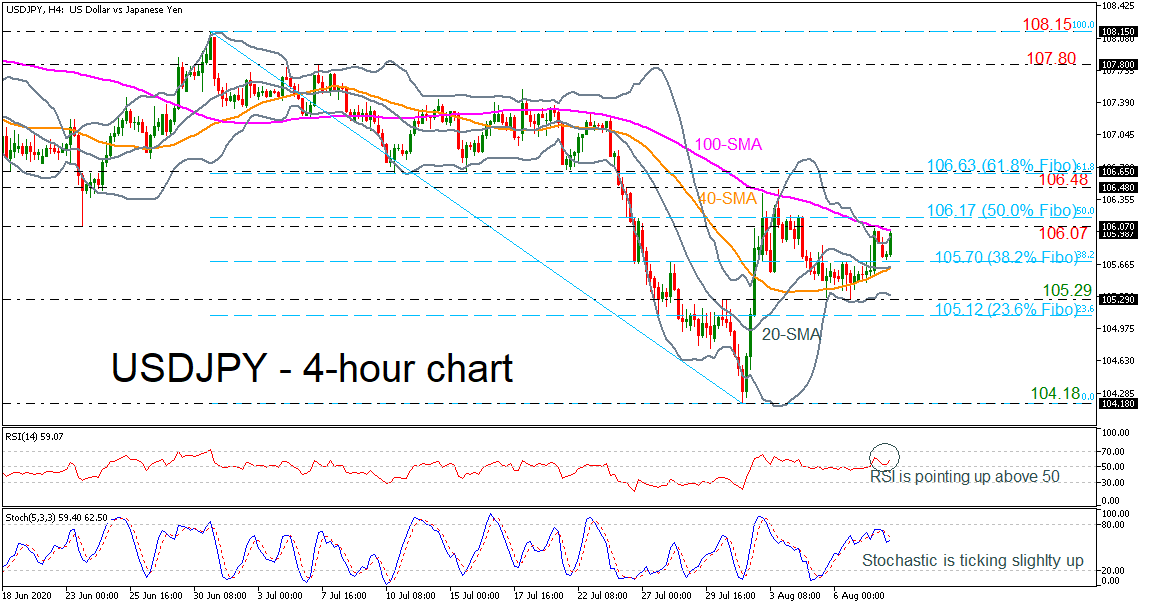
USDJPY is testing the 100-period simple moving average (SMA) in the 4-hour chart and the upper boundary of the Bollinger band, remaining around the 106.00 handle. The RSI indicator is pointing slightly up in the positive territory, while the stochastic oscillator is in process to post the bullish crossover within the %K and %D lines below the 80 level. A successful jump above the 106.07 resistance could open the way for the 50.0% Fibonacci retracement level of the down leg [..]

Technical Analysis – Gold’s stability may not be a worry above 2,000-1,939 zone

Posted on August 10, 2020 at 7:32 am GMT

Gold finished Friday’s session in the red after pulling slightly below its new record high of 2,079, but overall managed to add another constructive week for the ninth consecutive time. In the daily chart, technical signals remain cautiously bullish. The RSI hit a wall near its previous high in the overbought zone and reversed south, the Stochastics are also pointing downwards after printing a lower high, while the MACD, although above its red signal line, seems to be losing momentum. [..]

Technical Analysis – EURUSD returns lower after touching 27-month high above 1.1900

Posted on August 10, 2020 at 6:18 am GMT

EURUSD had been in a strong bullish rally until it reached a new 27-month high of 1.1915 on Thursday, that caused the pair to correct down below the 1.1800 round number. The technical indicators are losing momentum as the MACD completed a bearish crossover with its trigger line, while the RSI is hovering near the 70 level, failing to improve any positive actions. The 20- and 40-day simple moving averages (SMAs) are still heading upwards. Immediate support for further downside [..]

post-image

Technical Analysis – US 30 index stalls positive push above 200-SMA

Posted on August 7, 2020 at 12:45 pm GMT

US 30 stock index (Cash) recently thrusted above the 26,880 level, that being the 76.4% Fibonacci retracement of the down leg from 29,582 to 18,170, after finding some traction from the 200-day SMA at 26,295. The index’s positive momentum has slowed slightly as reflected in the short-term oscillators. The MACD, holding relatively steady in the positive region, has barely moved above its red trigger line, while the RSI has reversed ahead of the 70 mark. Furthermore, the Stochastics are located [..]

Risk Warning: Your capital is at risk. Leveraged products may not be suitable for everyone. Please consider our Risk Disclosure.