XM does not provide services to residents of the United States of America.

Technical Analysis

post-image

Technical Analysis – US 500 index strongly bullish; looking overbought

Posted on August 19, 2020 at 12:44 pm GMT

The US 500 index reached another all-time high of 3,397.36 earlier today as the index extends one of its fastest bulls run in its history. The momentum indicators are looking overbought as the RSI is flattening near the 70 level, while the MACD is moving sideways in the positive territory. Should prices reverse lower, immediate support could come at the red Tenkan-sen and the blue Kijun-sen lines at 3,360 and 3,290 respectively ahead of the 3,200 support, which coincides with [..]

post-image

Technical Analysis – Gold resumes ascent, steering above the Ichimoku cloud

Posted on August 19, 2020 at 12:35 pm GMT

  Gold has nudged back above the Ichimoku cloud and over the simple moving averages (SMAs) after a bounce off the 200-period SMA, around 1,863, resetting the upward action. The precious metal has recouped a decent amount of the losses from the all-time high of 2,074.89 to 1,863 low, and continues to be aided by the now bullish Ichimoku lines. The commodity’s positive sentiment appears restored above the cloud, despite the fresh bearish crossover of the 100-period SMA by the [..]

post-image

Technical Analysis – GBPJPY tries to continue the 2-month upward move

Posted on August 19, 2020 at 8:58 am GMT

GBPJPY is looking more neutral in the very short-term as prices are hovering above the simple moving averages (SMAs) and within the 138.55 – 140.18 region. Hence the upside momentum in the last week appears to have run out of steam as prices have been attempting and failing to close above the five-and-a-half-month high of 140.18. The technical indicators seem to be mixed. The MACD is slightly strengthening its momentum above its trigger line, while the RSI is pointing down [..]

post-image

Technical Analysis – USDJPY restrained in a drift sideways under SMAs

Posted on August 19, 2020 at 8:30 am GMT

USDJPY appears steadfast in a fairly horizontal direction relatively unaltered by the prevailing negative pressures from the gradual declining simple moving averages (SMAs). The price found some footing around the 105.20 level – that being the 61.8% Fibonacci retracement of the up leg from 101.17 to 111.71 – which has helped to keep the decline at bay and extend the consolidation. The MACD, in the negative region, is above but near its red trigger line, while the RSI improves in [..]

post-image

Technical Analysis – NZDUSD ticks up but still beneath uptrend line

Posted on August 19, 2020 at 7:03 am GMT

NZDUSD has ticked higher after the drop beneath the five-month ascending trend line in the previous week. The momentum indicators are gaining ground as the RSI surpassed the 50 level and is sloping north, while the stochastic oscillator is heading towards the overbought level following the bullish cross within the %K and %D lines. The price could hit the six-month peak of 0.6717 ahead of the 0.6750 resistance, registered on December 2019. Even higher, NZDUSD could turn traders’ focus at [..]

post-image

Technical Analysis – USDCAD relays gloomy forecast, despite foothold

Posted on August 18, 2020 at 2:23 pm GMT

USDCAD is conveying a negative trajectory despite its recent footing around the near seven-month low of 1.3153. The prevailing negative bearing of the simple moving averages (SMAs) further supports this view. The short-term oscillators are currently reflecting conflicting signals of directional momentum although on a broader scale, the picture is still tilting negative. The MACD, in the negative region, is falling below its red trigger line, while the RSI has climbed back above the 30 mark. The stochastic oscillator appears [..]

post-image

Technical Analysis – WTI crude oil find immediate obstacle at 42.90

Posted on August 18, 2020 at 12:46 pm GMT

WTI crude oil futures have found significant resistance at the 42.90 barrier over the last couple of weeks. The technical indicators are showing mixed signals as the RSI is pointing slightly down, while the MACD completed a bullish crossover with its trigger line above the zero line. The Ichimoku lines and the moving averages are still signaling a somewhat upside tendency in the 4-hour chart. In the wake of positive pressures, the market could meet resistance at the five-month high [..]

post-image

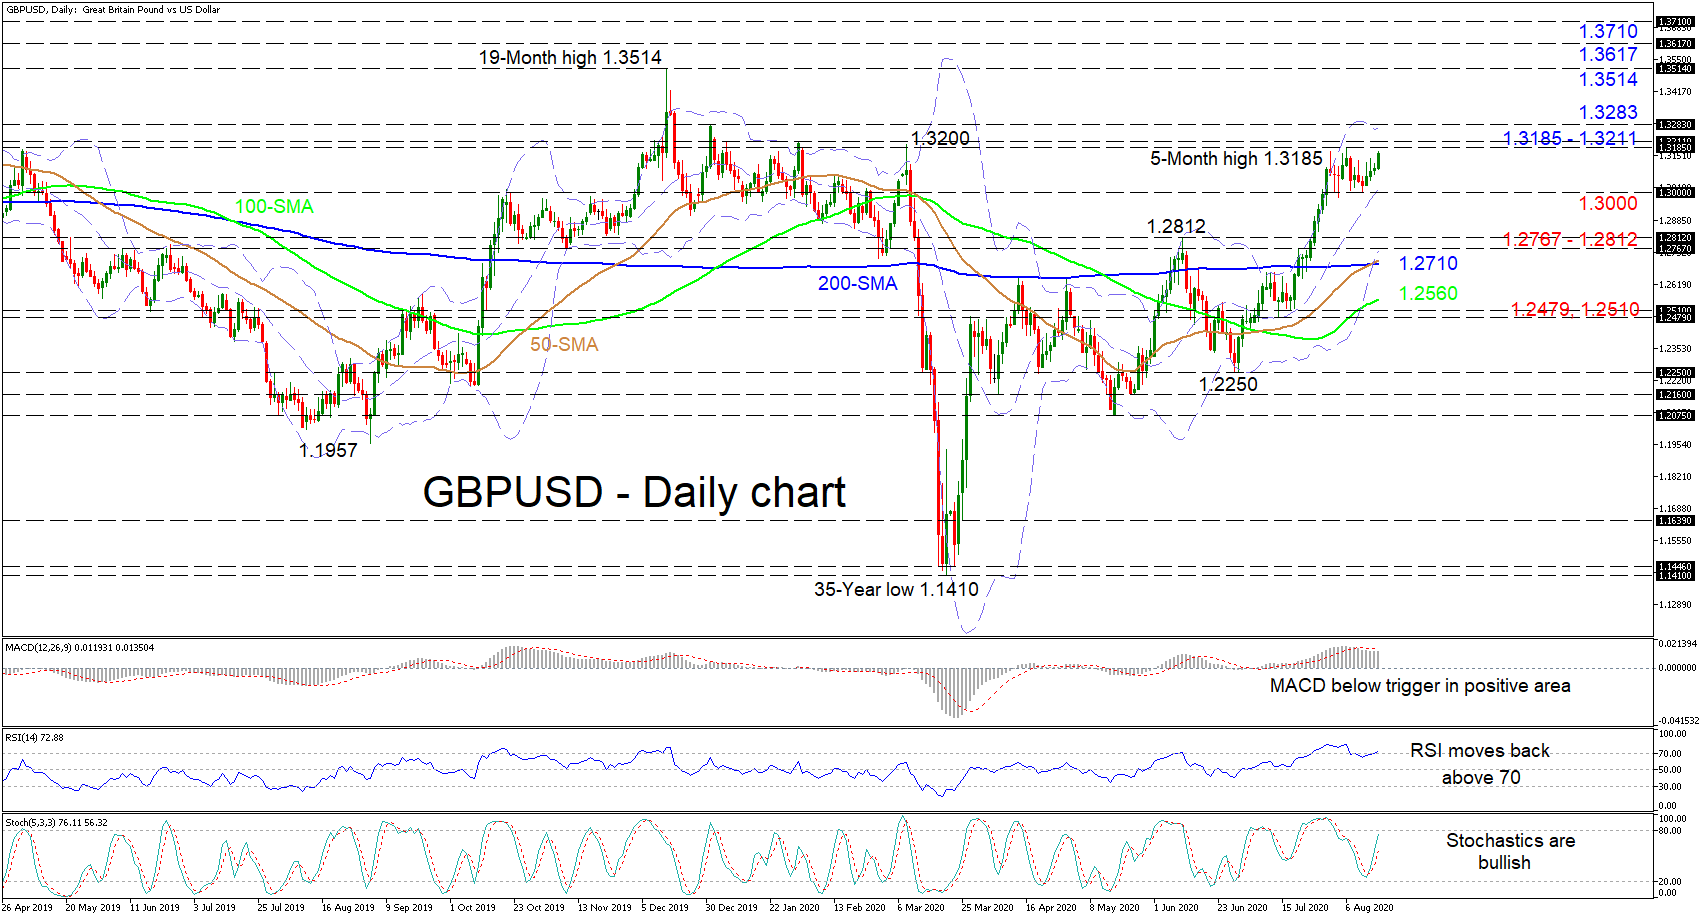
Technical Analysis – GBPUSD appreciates, targeting durable resistance border

Posted on August 18, 2020 at 8:13 am GMT

GBPUSD is in the process of re-examining the toughened resistance zone from 1.3185 – 1.3211, which has been keeping advances at bay. The strengthening 50- and 100-day simple moving averages (SMAs) and the recent bullish crossover of the 200-day SMA by the 50-day one, suggest further gains may unfold. Glancing at the short-term oscillators, they reflect a pickup in positive momentum. The MACD, some distance in the positive region, is holding below its red trigger line and appears it could [..]

post-image

Technical Analysis – EURJPY decreases but the outlook is strongly bullish

Posted on August 18, 2020 at 7:11 am GMT

EURJPY completed two consecutive negative days after it challenged a fresh 16-month high of 126.74 in the previous week. The steep upside movement is still in place and it has been holding since May 6, when it pulled back from the 114.40 support level. From the technical viewpoint, the price is remaining above the simple moving averages (SMAs) in the daily timeframe, however, the momentum indicators are reflecting the recent downside move. The MACD is losing ground beneath its trigger [..]

post-image

Technical Analysis – AUDUSD exhibits slowing ascent; positive risks persist

Posted on August 17, 2020 at 12:50 pm GMT

AUDUSD appears to have secured its positive bearing for now, as the price nudged back above the simple moving averages (SMAs) and the Ichimoku cloud. Once again, the price resisted negative pressures and now stands on top of the 50-period SMA at the cloud’s upper surface at 0.7177. Yet, the recently directionless Ichimoku lines sponsor a restrained mode within the pair. Nonetheless, the short-term oscillators reflect some improvement in positive momentum. The MACD has advanced above its red trigger line [..]

Risk Warning: Your capital is at risk. Leveraged products may not be suitable for everyone. Please consider our Risk Disclosure.