XM does not provide services to residents of the United States of America.

Technical Analysis

post-image

Technical Analysis – USDCAD transmits negative prognosis, weakening prevails

Posted on August 21, 2020 at 6:32 am GMT

USDCAD appears to have declared a negative route below the descending line drawn from the 50-month peak of 1.4667. The bearish tone of the 50- and 100-day simple moving averages (SMAs) and the falling mid-Bollinger band (20-day SMA), which has merged with the diagonal line, further aid the broader negative outlook. The short-term oscillators are uttering temporary mixed signals in directional momentum. The MACD, in the negative region, is marginally above its red signal line as they both follow a [..]

post-image

Technical Analysis – GBPJPY moves horizontally; bullish bias

Posted on August 21, 2020 at 6:25 am GMT

GBPJPY has been holding in a horizontal trajectory over the last week following the bounce off the 24-week peak of 140.19. However, the price is still developing above the five-month ascending trend line.  Technically, the RSI indicator is moving marginally up in the positive area, while the stochastic is posting a bullish crossover within the %K and %D lines. More upside movements could take the price towards the immediate 140.90 resistance before creating a steeper increase until the 144.95 barrier, taken from the peak [..]

post-image

Technical Analysis – AUDNZD gears up for another test of 2-year highs

Posted on August 20, 2020 at 3:02 pm GMT

AUDNZD jumped to a fresh 2-year high of 1.1040 earlier this week, though the pair encountered strong resistance near that area and subsequently pulled back. Now, the bulls have taken over again and the price seems to be headed for another test of that zone. A potential break above it would reinforce confidence in the uptrend. Short-term momentum oscillators on the four-hour chart are reflecting the latest spike higher. The RSI is already above 50 and looks to be headed [..]

post-image

Technical Analysis – Apple’s relentless rally continues, sets new records

Posted on August 20, 2020 at 1:43 pm GMT

Apple’s stock touched a new record high of 468.5 this week, continuing its relentless five-month rally, with the price having more than doubled since its March lows. The chart is as bullish as it can be, with an uninterrupted structure of higher highs and higher lows, and the price action taking place above all its simple moving averages (SMAs), which are pointing higher. Momentum oscillators mostly paint a positive picture as well. The MACD is above zero and over its [..]

post-image

Technical Analysis – EURJPY undergoes downside pressures; uptrend confronted

Posted on August 20, 2020 at 1:33 pm GMT

EURJPY is currently suffering negative stresses, which are attempting to destabilize the steady ascent from the 119.30 low. The price has retreated past the 50-period simple moving average (SMA) at 125.67 and below the Ichimoku cloud, until the 100-period SMA, strengthening negative momentum, something also displayed in the short-term oscillators. The MACD is fading below its red signal line and the zero mark, while the RSI is receding below the diagonal line in bearish territory. Furthermore, the stochastic oscillator has [..]

post-image

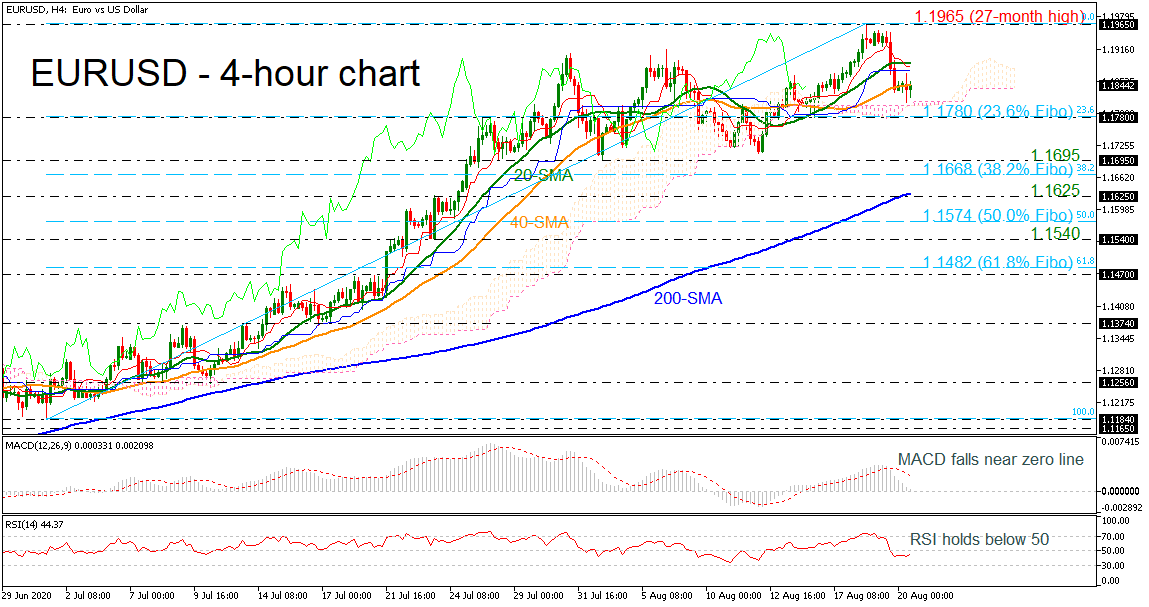
Technical Analysis – EURUSD loses momentum beneath 27-month high

Posted on August 20, 2020 at 1:00 pm GMT

EURUSD is on course for a bearish correction after the spike on the 27-month peak of 1.1965 on Tuesday. The sell-off, especially on Wednesday, has drove the price near the 40-period simple moving average (SMA) in the 4-hour chart. The momentum indicators are supportive of the bearish picture, with the RSI remaning inside negative territory, the MACD losing ground towards the zero line. Immediate support is being provided by the Ichimoku cloud around 1.1811 ahead of the 23.6% Fibonacci retracement [..]

post-image

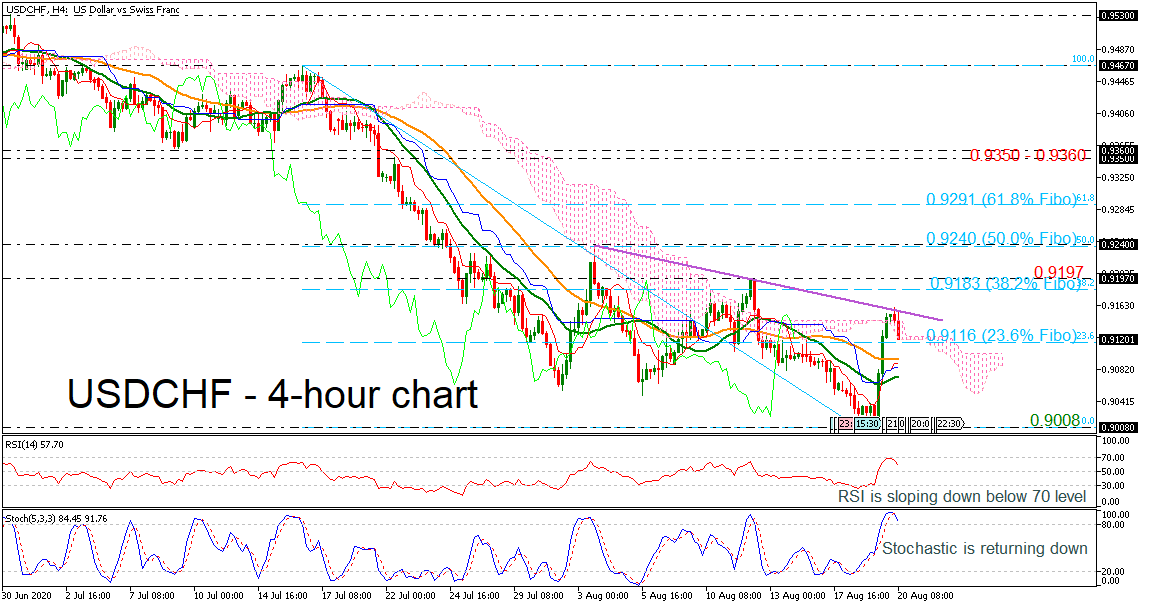
Technical Analysis – USDCHF tumbles after the pullback on the falling trend line

Posted on August 20, 2020 at 12:16 pm GMT

USDCHF pulled back on the two-week descending trend line around 0.9160 after the aggressive buying interest in the preceding sessions. The RSI rebounded on the 70 level, while the stochastic oscillator created a bearish crossover within its trigger and zero lines in the overbought region. Both are suggesting the continuation of the bearish sentiment. If the pair weakens, the 23.6% Fibonacci retracement level of the down leg from 0.9467 to 0.9008 at 0.9116 could provide immediate support ahead of the [..]

post-image

Technical Analysis – AUDJPY capped by recent highs, uptrend pauses

Posted on August 20, 2020 at 11:14 am GMT

AUDJPY has been trading in a narrow sideways range for a month now, between 76.80 and 74.70. A break in either direction is needed to reveal the pair’s short-term tendency, though in the bigger picture, only a decisive move below 72.70 would call into question the five-month uptrend.   Short-term oscillators detect fading upside momentum and imply that the pair could test the lower bound of its recent range soon. The RSI is pointing down and looks ready to cross [..]

post-image

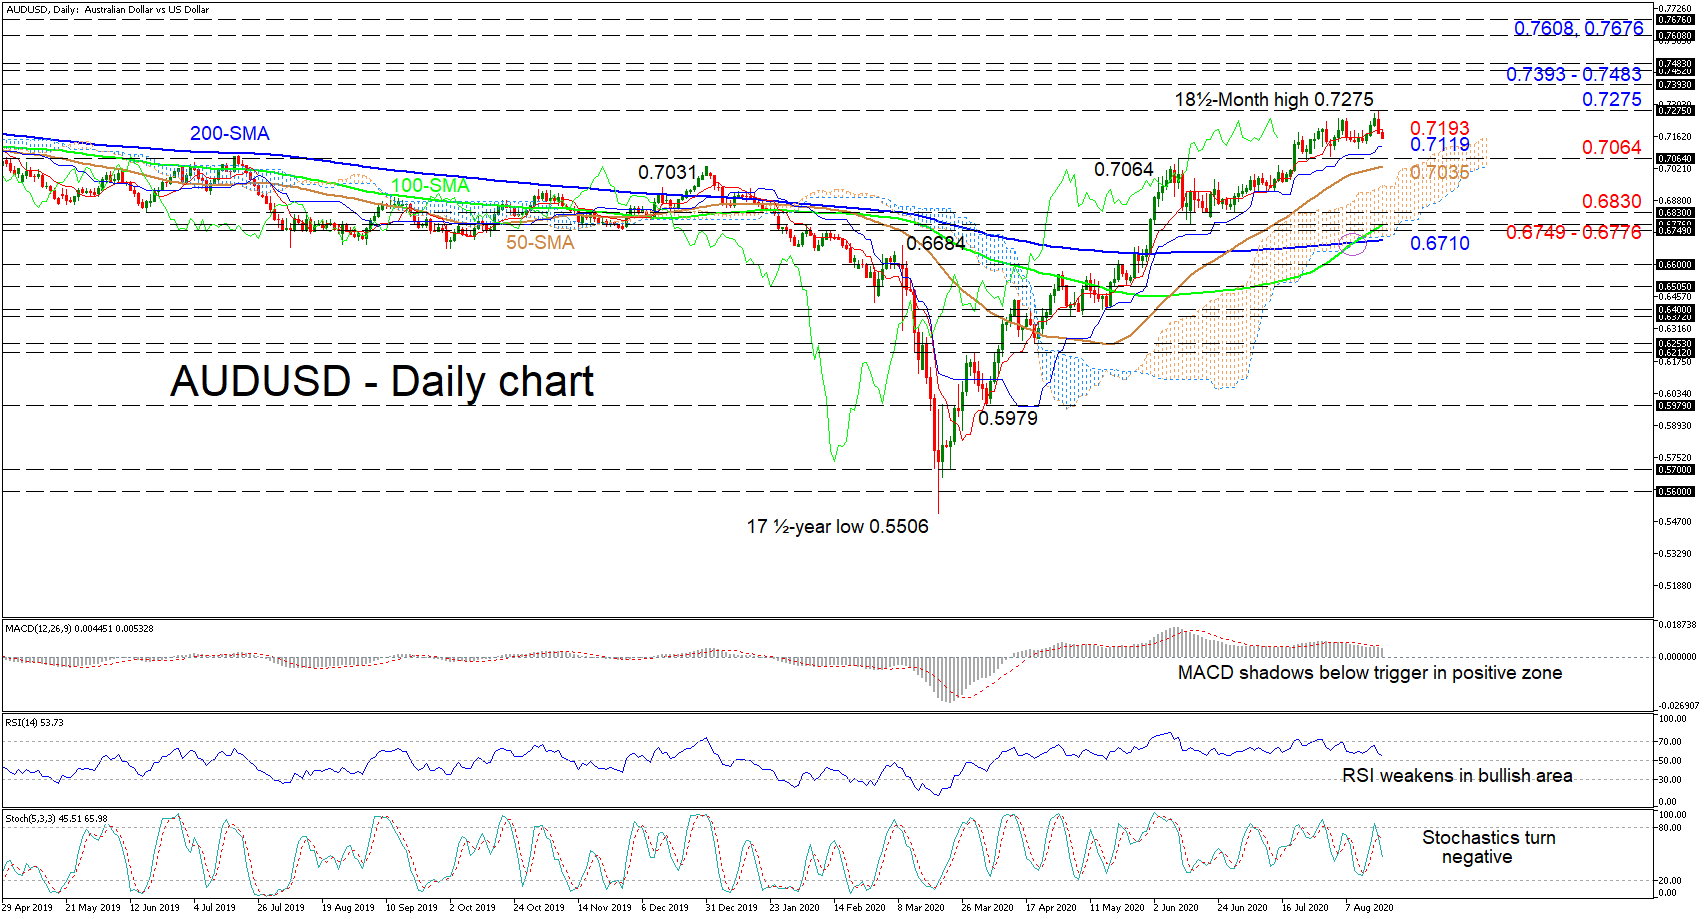
Technical Analysis – AUDUSD retains steady positive tone despite pullback

Posted on August 20, 2020 at 8:22 am GMT

AUDUSD has managed to preserve its five-month progression from the 17½-year low of 0.5506 to the fresh high of 0.7275. The bullish simple moving averages (SMAs) and the positive demeanour of the Ichimoku lines continue to convey optimism in the pair, despite its recent weakening. The technical oscillators mirror the current pullback in the pair displaying the fading in positive momentum. The MACD, in the positive region, is cautiously trailing below the red signal line, while the RSI is waning [..]

post-image

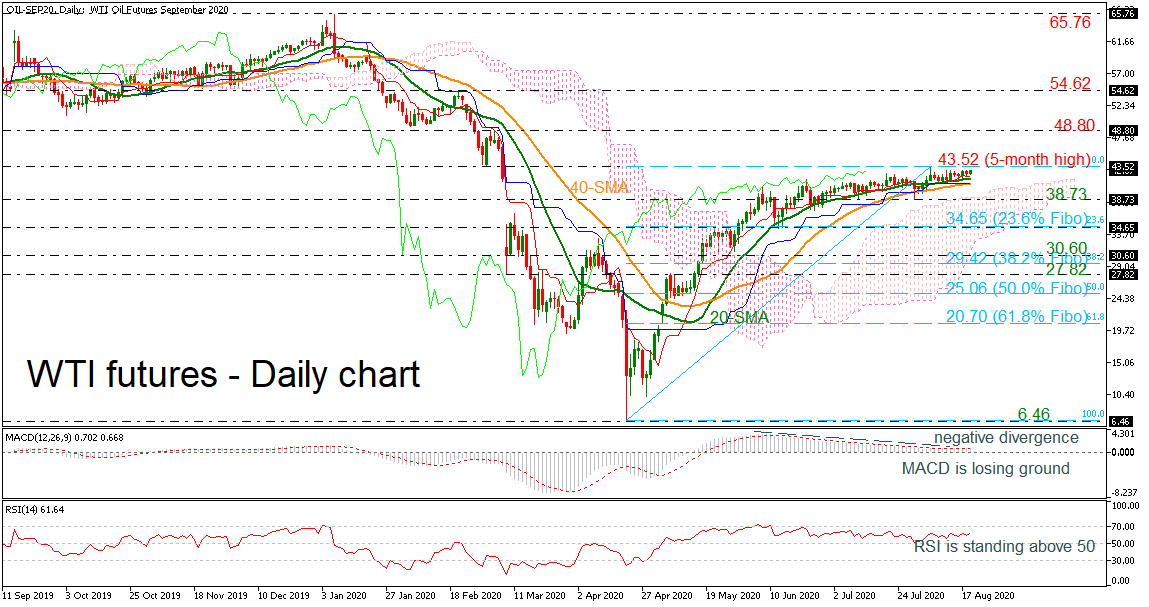
Technical Analysis – WTI futures develop with weak momentum near 5-month high

Posted on August 20, 2020 at 7:15 am GMT

WTI crude oil is moving sideways in the short-term, in a slightly bullish structure beneath the five-month high of 43.52. The 20- and 40-day simple moving averages (SMAs) are acting as strong support for the bears; however, the MACD oscillator is indicating a negative divergence in the market, signaling a possible bearish retracement. A successful climb above the five-month high of 43.52 could challenge the 48.80 resistance, registered on March 3. Even higher, the 54.62 barrier taken from the peak [..]

Risk Warning: Your capital is at risk. Leveraged products may not be suitable for everyone. Please consider our Risk Disclosure.