XM does not provide services to residents of the United States of America.

Technical Analysis

Technical Analysis – EURUSD although paused, conveys robust upside risks

Posted on August 31, 2020 at 7:41 am GMT

EURUSD maintains a solid bullish mode, despite appearing stuck within the confines of 1.1695 and 1.1965. The Ichimoku lines are broadcasting a positive bearing regardless of the recent stalling in the red Tenkan-sen line. Likewise, the progressing simple moving averages (SMAs) command a resounding bullish bias. Additionally, the short-term oscillators suggest positive momentum is improving. The MACD, deep in the positive section, is below its red signal line but looks set to reclaim it, while the RSI is nearing the [..]

Technical Analysis – Gold capped by SMA but retains bullish outlook

Posted on August 31, 2020 at 7:05 am GMT

Gold prices have been capped by the 20-day simple moving average (SMA) but have found strong support at the 1,900 psychological level. The sideways move over the last week is confirmed by the RSI indicator, which is flattening near the neutral threshold of 50, while the red Tenkan-sen and the blue Kijun-sen lines are moving horizontally as well. However, the MACD oscillator is trying to strengthen its momentum below its trigger line and above the zero level. A successful jump [..]

post-image

Technical Analysis – NZDUSD’s ascent quickens; bullish signals enhance bias

Posted on August 28, 2020 at 11:45 am GMT

NZDUSD is fuelling the ascent from the 0.6487 level with its thrust above the high of 0.6690. The positive picture was aided by the strong bullish signals present in the rising Ichimoku lines and the short-term oscillators. Additionally, the approaching bullish crossover of the 100-period simple moving average (SMA) by the 50-period one may further boost the positive picture. The short-term oscillators reflect strengthening positive momentum. The MACD, deep in the positive section, is accelerating above its red signal line, [..]

post-image

Technical Analysis – GBPUSD edges below 8-month peak; holds in neutral zone

Posted on August 28, 2020 at 9:14 am GMT

GBPUSD surges to an eight-month high around 1.3290 on Friday, trying to overcome the consolidation area that has been holding since August 13. Looking to the short-term oscillators, the MACD and the RSI promote slight improvements as they are strengthening their momentum, despite diminished directional momentum. Yet, the increasing 20- and 40-period simple moving averages (SMAs) maintain a bullish tone. Should buyers drive above the 1.3290 strong resistance, they could encounter initial strengthened resistance from the 1.3513 peak, registered on [..]

post-image

Technical Analysis – GBPJPY hits a snag trying to resume positive trajectory

Posted on August 28, 2020 at 7:39 am GMT

GBPJPY is gaining ground, currently striving to close above 140.82 to clearly resume the climb. The steady incline is also sponsored by the progressing Ichimoku lines and the advancing 50- and 100-day simple moving averages (SMAs). Additionally, an approaching bullish crossover of the 200-day SMA by the 50-day one may fortify the positive outlook. The short-term oscillators further support an improving picture. The MACD, some distance in the positive area, is above its red signal line, while the RSI is [..]

post-image

Technical Analysis – USDCAD unlocks fresh 7-month low below 1.3100

Posted on August 28, 2020 at 7:10 am GMT

USDCAD has been posting more losses as it completed a fresh seven-month low of 1.3085 earlier today, remaining in a descending channel over the last five months. The momentum indicators are currently encouraging the sell-off as the MACD oscillator is developing beneath its trigger and zero lines, while the RSI is trying to meet the oversold territory. Both the Ichimocku indicators, the red Tenkan-sen and the blue Kijun-sen lines, and the 20- and 40-day simple moving averages (SMAs) are heading south [..]

post-image

Technical Analysis – Copper futures’ uptrend intact; positive backing present

Posted on August 27, 2020 at 2:47 pm GMT

Copper futures maintain a steady bullish bearing after a bounce on the 50-day simple moving average (SMA), which sent the commodity to a 25-Month peak of 3.040. The rising red Tenkan-sen line is promoting additional advances, while the bullish crossover of the 200-day SMA by the 100-day one may further boost the predominant positive picture. The short-term oscillators also endorse an improving outcome. The MACD and the stochastic oscillator suggest positive momentum is increasing despite the pause displayed in the [..]

post-image

Technical Analysis – EURJPY edges sideways as progress remains capped

Posted on August 27, 2020 at 1:02 pm GMT

EURJPY appears to be maintaining a horizontal-to-downside trajectory trapped near the 20- and 40-period simple moving average (SMA) as well as the 100-period SMA. A paused state of directional momentum is reflected in the Ichimoku lines, while the price rests around the lower surface of the Ichimoku cloud. The negative signals in the short-term oscillators further reflect the stall in the price. The RSI has barely inched below the 50 leve and the stochastic %K line is ticking down after it [..]

post-image

Technical Analysis – USDCHF fades further; negative formation prevails

Posted on August 27, 2020 at 12:38 pm GMT

USDCHF is currently restricted by a very short-term diagonal line, which is maintaining the price’s bearish tone within a confirmed broader negative pattern.  Further aiding the moulded negative picture is the bearish bearing of the Ichimoku lines and the simple moving averages (SMAs). That said, the short-term oscillators are emitting conflicting signals in directional momentum. The MACD, in the negative region, is strengthening above its red signal line, while the RSI is improving in bearish territory. Nonetheless, the negative demeanour [..]

post-image

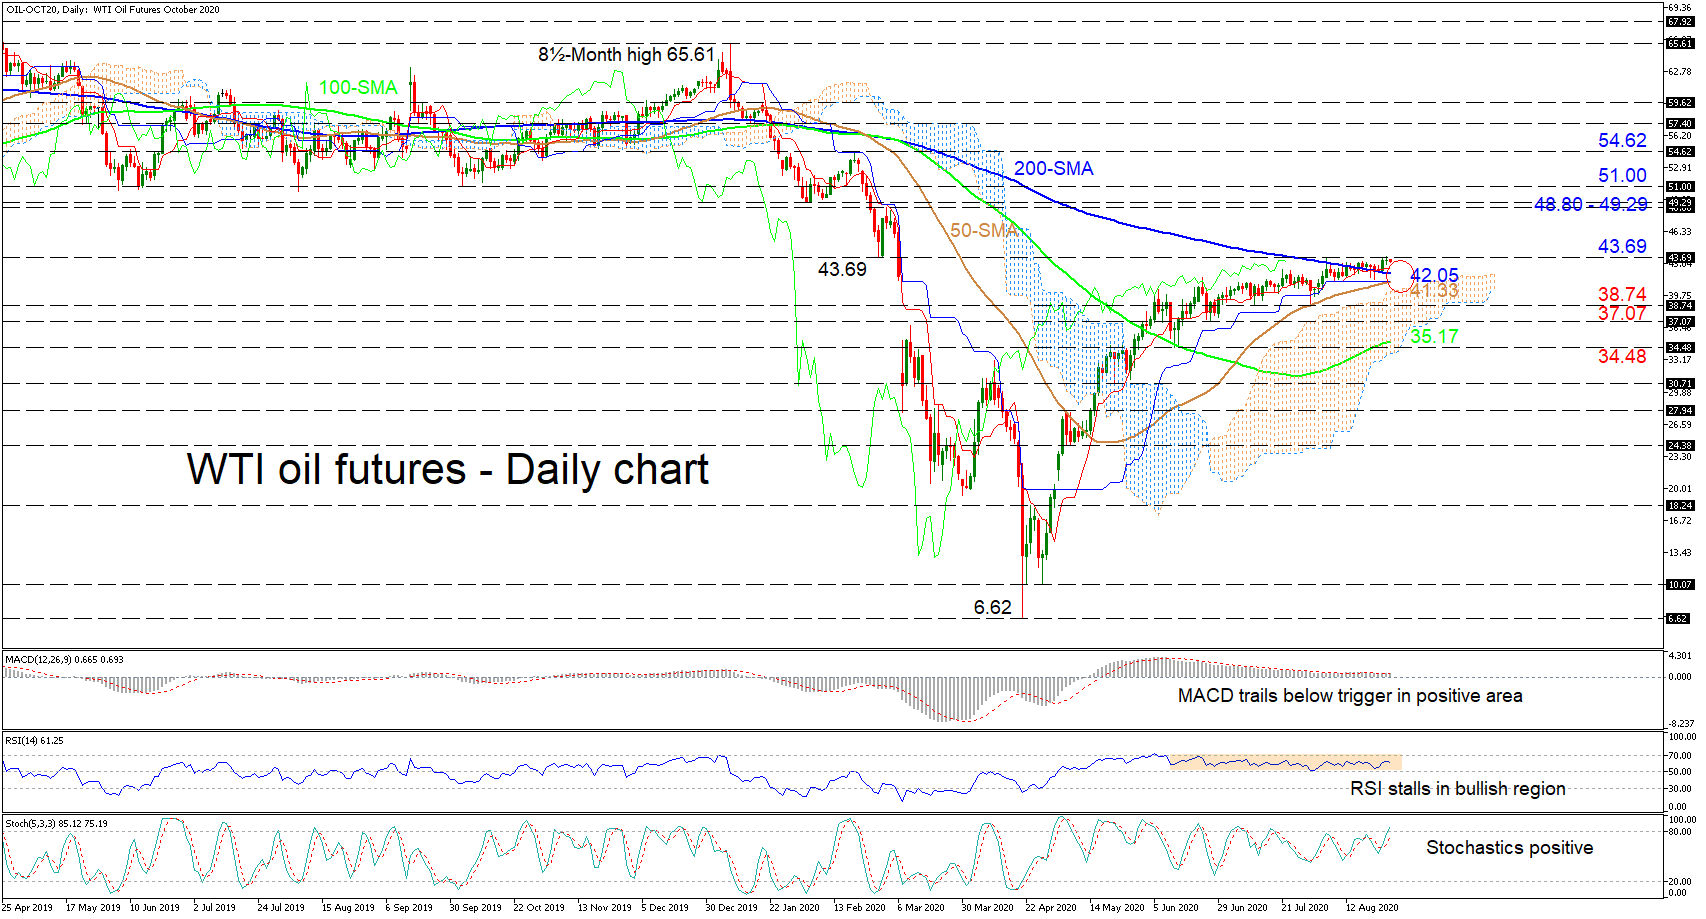
Technical Analysis – WTI futures struggle after conquering 200-day SMA

Posted on August 27, 2020 at 9:00 am GMT

WTI oil futures are striving to overcome a critical resistance at 43.69, after having nudged over the 200-day simple moving average (SMA). Positive momentum has been gradually shrinking for approximately two-months, mirrored in the flattening out of the Ichimoku lines. Yet, the price continues to steadily crawl higher, maintaining a positive tone above the SMAs and the Ichimoku cloud. The short-term oscillators further reflect the anaemic positive momentum. The MACD, slightly in the positive region, continues to drag below its [..]

Risk Warning: Your capital is at risk. Leveraged products may not be suitable for everyone. Please consider our Risk Disclosure.