XM does not provide services to residents of the United States of America.

Technical Analysis

post-image

Technical Analysis – WTI futures plunge to new 2-month low

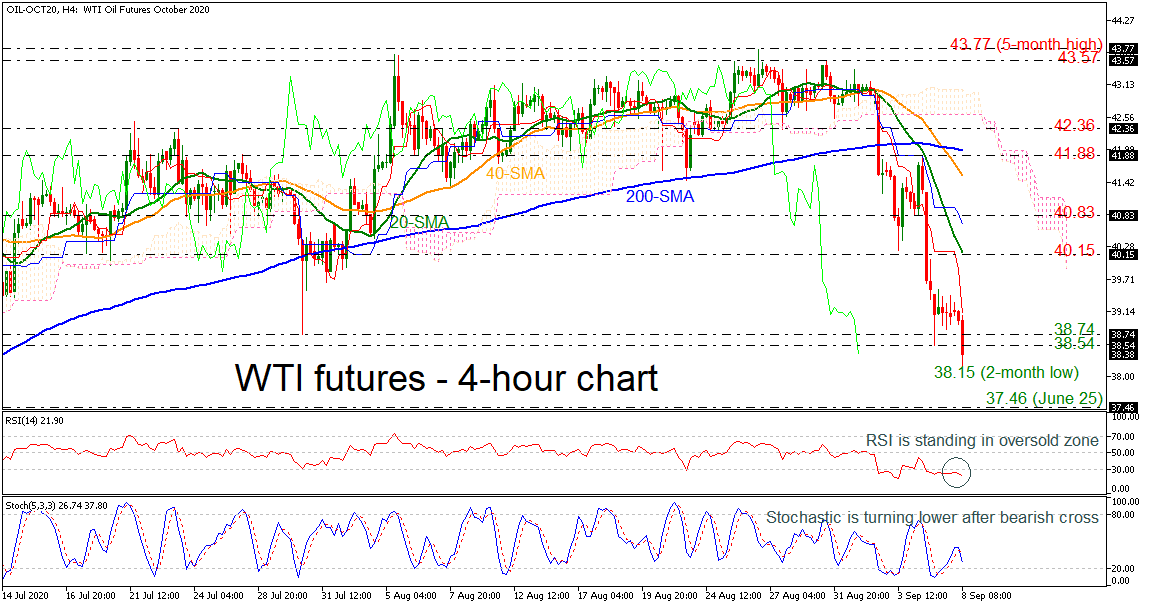
Posted on September 8, 2020 at 9:13 am GMT

Since its deep fall towards a two-month low of 38.15 earlier today, WTI crude oil futures have been trading within a descending movement after the pullback from 43.77. The technical picture supports a bearish structure in the short-term timeframe.   Looking at momentum indicators, the RSI is holding in the oversold zone with weak momentum, while the stochastic oscillator posted a bearish crossover within its %K and %D lines and is moving lower towards the 20 line. In the wake [..]

Technical Analysis – EURJPY withdraws from fresh high; bullish bias seems undamaged

Posted on September 8, 2020 at 8:14 am GMT

EURJPY receded from its latest 18-month peak of 127.06, pausing to some extent its climb from 119.30. The preserved positive demeanour of the Ichimoku lines and the bullish tone of the simple moving averages (SMAs) defend the current positive picture. Looking at the short-term oscillators, they reflect the recent pullback in price but positive momentum appears to refuse to give in. The MACD, although below its red signal line, remains some distance in the positive region, while the faded RSI [..]

Technical Analysis – GBPUSD rejected from 8½-month high; next level 1.30

Posted on September 8, 2020 at 6:49 am GMT

GBPUSD has reversed back down again after finding resistance at the eight-and-a-half-month high of 1.3487 achieved last week. The momentum indicators are pointing to a neutral to negative bias in the short term with the RSI holding near the 50 level and the MACD oscillator falling below the trigger line in the positive zone. Moreover, the price declined below the 20-day simple moving average (SMA) and is heading towards the five-month ascending trend line. Further losses should see the 40-day [..]

post-image

Technical Analysis – USDJPY lifeless, confined in a horizontal structure

Posted on September 7, 2020 at 3:33 pm GMT

USDJPY remains ruled by a sideways market, maintaining the price between the boundaries of 105.09 and 107.04. The Ichimoku cloud and lines still reflect weak directional momentum, while the gliding and converged simple moving averages (SMAs) appear powerless in assisting the price out of this range. The short-term oscillators further display the non-existent directional momentum. The MACD, slightly above zero, is floating just below its red trigger line, while the RSI is pointing upwards near its 50 threshold. The stochastic [..]

post-image

Technical Analysis – US 500 index corrects sharply from fresh all-time high

Posted on September 7, 2020 at 1:19 pm GMT

US 500 index (Cash) recently plummeted from its new all-time top of 3,588, spiking below the 200-period simple moving average (SMA) until the 3,348 trough from August 20. It appears that negative pressures are abating, mirrored in the flattening of the Ichimoku lines and as price stalls. Furthermore, the short-term oscillators also suggest some subsiding in the negative picture. The stochastic oscillator appears to be strengthening. The MACD’s decline, in the negative region, seems to have started to ease, while [..]

post-image

Technical Analysis – EURAUD flirts with SMA bullish cross

Posted on September 7, 2020 at 1:03 pm GMT

EURAUD is finding significant support at the 23.6% Fibonacci retracement level of the down leg from 1.6550 to 1.6126 at 1.6225, remaining above the bullish cross created within the 20- and 40-period simple moving averages (SMAs) in the 4-hour chart. The latest drop off the 1.6325 resistance drove the stochastics lower, though the indicator has already posted a bullish cross within the %K and %D lines below the 20 oversold mark. Moreover, the MACD oscillator is moving horizontally below the trigger line and near [..]

post-image

Technical Analysis – AUDUSD weakens inside Ichimoku cloud; negative bias in near term

Posted on September 7, 2020 at 8:43 am GMT

AUDUSD has been underperforming in the past two trading days, breaking back below the key 0.7300 level. When looking at the bigger picture the pair has been holding in ascending movement since July 24.   On the 4-hour chart, prices rebounded off the 0.7220 support level but failed to jump above the 20-period simple moving average (SMA). Based on technical indicators, momentum is too weak to provide a sustained move higher. The RSI is below 50 and the MACD is [..]

Technical Analysis – Gold sustains bullish tone despite crawling sideways

Posted on September 7, 2020 at 8:15 am GMT

Gold is currently extending a sideways pattern above the simple moving averages (SMAs) and the 1,900 psychological number. Directional momentum has dried up as displayed by the steadied Ichimoku lines. Nonetheless, the rising SMAs continue to dictate a predominant bullish bias. The short-term oscillators reflect a relatively paused picture under a restrictive diagonal line drawn from the all-time high. The MACD has remained somewhat in the positive region but beneath its red signal line, while the RSI hovers marginally underneath [..]

Technical Analysis – EURUSD loses steam after spike to 29-month peak above 1.20

Posted on September 7, 2020 at 7:11 am GMT

EURUSD is edging lower after the spike towards the 29-month high of 1.2009 on September 1. The four consecutive red days drove the market below the 20-period simple moving average (SMA) and the technical indicators are confirming a bearish retracement. The MACD continues to hold below the trigger line in the positive zone, while the RSI is ready to touch the neutral threshold of 50. The next target to the downside is the 1.1755 support level, which overlaps with the [..]

post-image

Technical Analysis – NZDUSD’s foothold near 50-MA rescues positive bias

Posted on September 4, 2020 at 11:03 am GMT

NZDUSD’s drawback from the 13½-month high of 0.6789 appears to be restoring positive sentiment, after finding some traction around the 50-period period simple moving average (SMA) at 0.6687. The advancing SMAs and the approaching bullish crossover of the 200-period SMA by the 100-period one may re-establish confidence in the climb. The Ichimoku lines seem to have paused their negative bearing, while the short-term oscillators display a pick-up in positive momentum. The MACD looks set on improving from the zero area, [..]

Risk Warning: Your capital is at risk. Leveraged products may not be suitable for everyone. Please consider our Risk Disclosure.