XM does not provide services to residents of the United States of America.

Technical Analysis

post-image

Technical Analysis – Gold develops in symmetrical triangle; lacks clear direction

Posted on September 16, 2020 at 6:58 am GMT

Gold prices have been trading within a triangle formation in the short term with a break outside it likely to determine the next trend direction. Looking at momentum oscillators on the 4-hout chart, they suggest further sideways moves may be on the cards. The RSI is pointing south above its neutral 50 line, detecting negative momentum, while the MACD lies below its trigger line with horizontal movement above its zero level. Currently, the precious metal stands above the short-term moving [..]

Technical Analysis – NZDUSD keeps bullish bias intact; next resistance at 0.6787

Posted on September 16, 2020 at 6:51 am GMT

NZDUSD printed another higher low around the ascending trendline drawn from the March lows and its shorter-term simple moving averages (SMA), further strengthening its six-month old uptrend. The positive slope in the RSI and the Stochastics, and the soft rebound in the MACD, which is set to cross back above its red signal line, suggest that there is more bullish action in store. The 20- and 50-day SMAs back this view too as the lines continue to point upwards. Still, [..]

post-image

Technical Analysis – WTI futures exit from short-term symmetrical triangle

Posted on September 15, 2020 at 8:57 am GMT

WTI crude oil futures have been in a tight symmetrical triangle over the last week, failing to decline further in the short-term. The price found strong resistance around the 20-period simple moving average (SMA) and the minor descending line. The RSI indicator is pointing slightly up in the negative territory, while the MACD is increasing above the trigger line, both suggesting an upside penetration of the pattern. Should the pair stretch north, the 40-period SMA at 37.74 could provide immediate [..]

post-image

Technical Analysis – GBPUSD exhibits mixed directional signals, injuring sell-off

Posted on September 15, 2020 at 8:13 am GMT

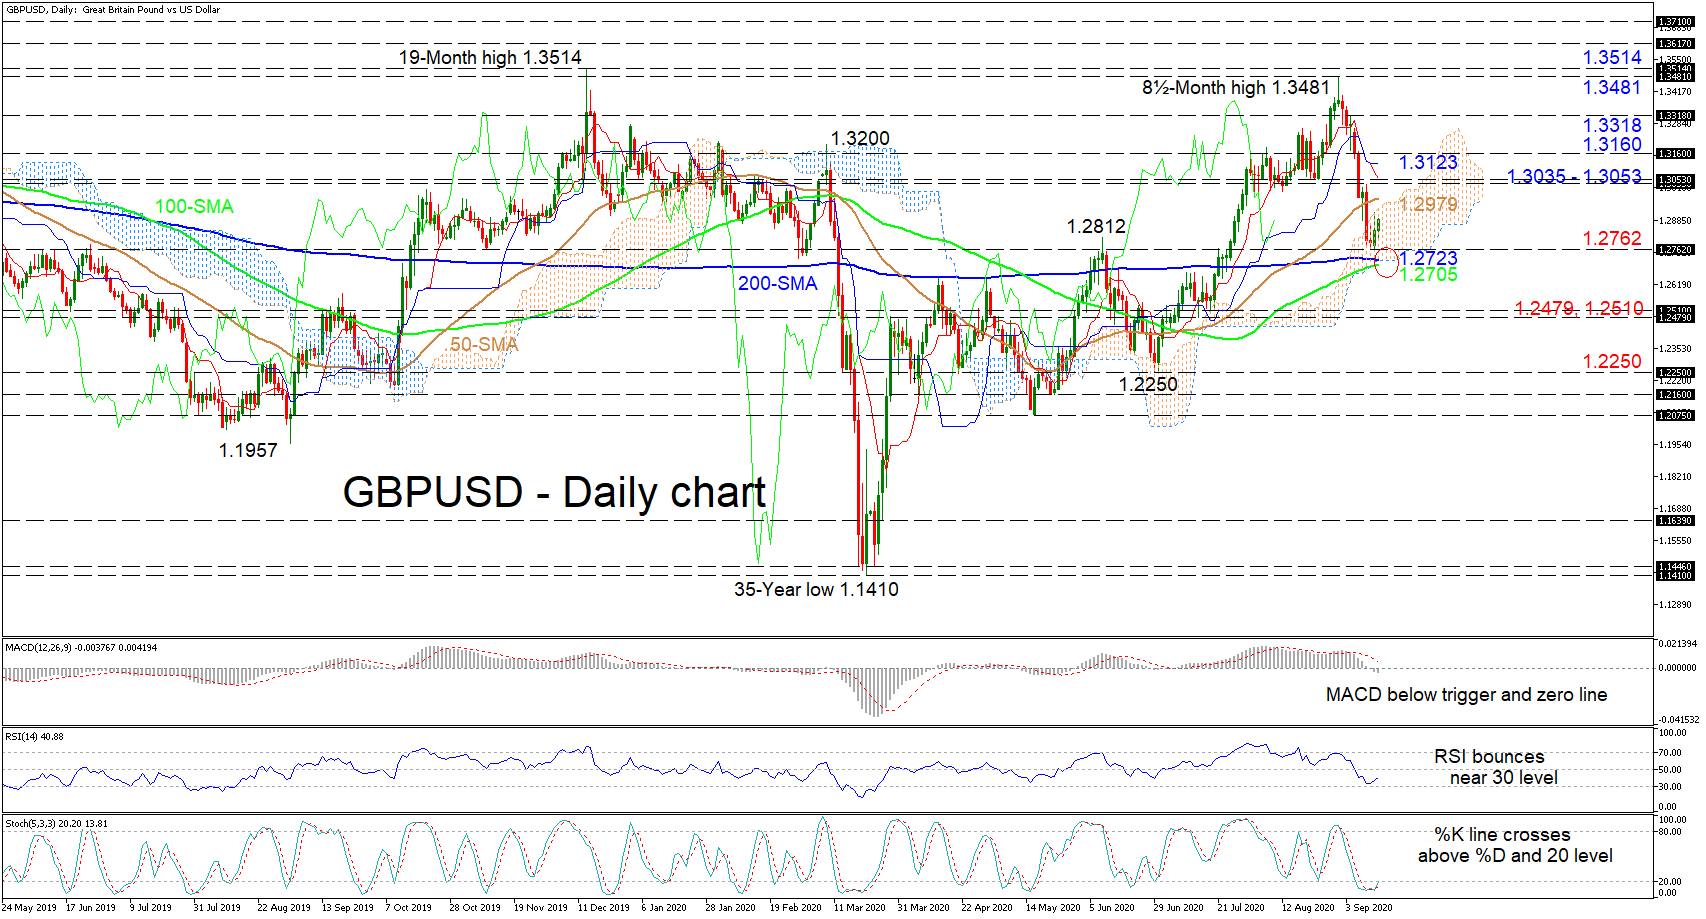
GBPUSD has pivoted at the 1.2762 level within the Ichimoku cloud and near the 200-day simple moving average (SMA), disrupting the correction from the 8½-month peak of 1.3481. Aiding downside pressure is the falling red Tenkan-sen line, which has crossed under its blue-Kijun-sen line. The MACD, below its red trigger line is sponsoring negative price action as it dips further below the zero mark. Nonetheless, the RSI’s rebound ahead of the 30 level suggests a pick-up in positive momentum. The [..]

Technical Analysis – EURJPY sets up a trend reversal pattern after peak at 127.00

Posted on September 15, 2020 at 7:29 am GMT

EURJPY is eying the formation of a potential bearish head and shoulder pattern, with a head at 127.06 and a neckline around 124.40, hinting that the rally may be losing steam and it’s time to reverse south. The slowdown in the 20-day simple moving average (SMA) and the negative cross between the red Tenkan-sen and the blue Kijun-sen lines for the first time since June is another warning that downside pressures may dominate in the short-term. Meanwhile, the RSI is struggling to gain [..]

post-image

Technical Analysis – UK 100 index struggles beneath cloud and negative trend line

Posted on September 14, 2020 at 1:49 pm GMT

UK 100 stock index (Cash) appears to be gradually fading below the very short-term descending line and the Ichimoku cloud. The flattened blue Kijun-sen line promotes a fairly sideways picture in the price, while the capping 50- and 100-day simple moving averages (SMAs) and the cloud’s lower surface suggest negative tensions may intensify in the index. That said, the upward sloping red Tenkan-sen line is reflecting current price attempts to develop further, while the RSI is climbing above its neutral [..]

post-image

Technical Analysis – USDJPY tests symmetrical triangle in short term

Posted on September 14, 2020 at 12:58 pm GMT

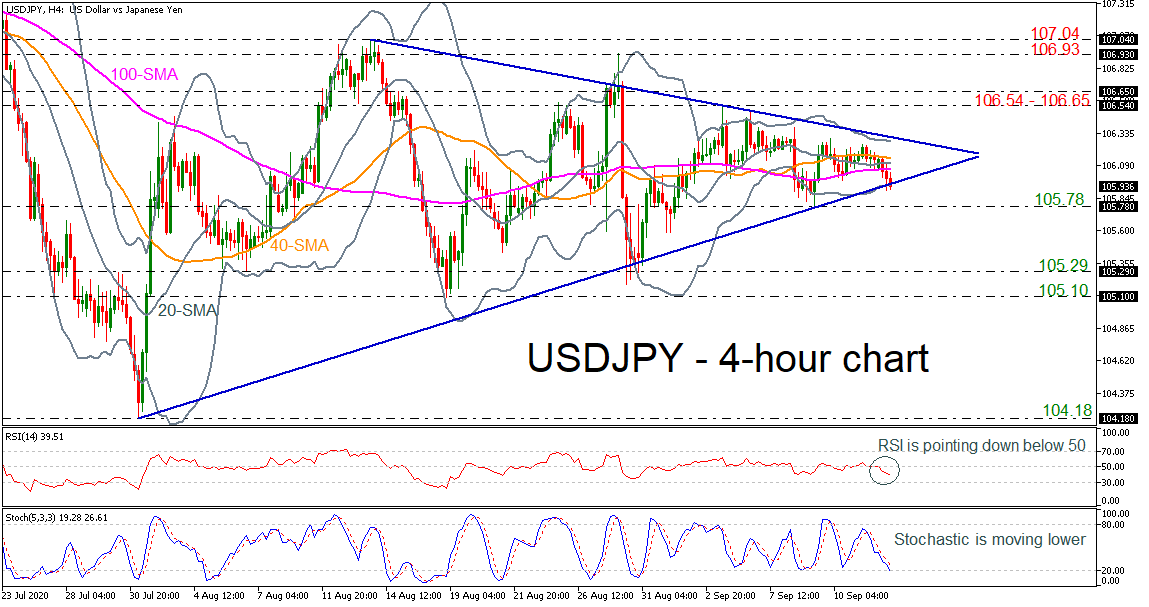
USDJPY has been trading within a symmetrical triangle since July 31 and is currently testing the ascending line of the pattern and the lower Bollinger band. The RSI indicator is falling in the negative territory, while the stochastic is approaching the oversold zone with strong momentum. The short-term simple moving averages (SMAs) are acting as strong resistance for the bulls. If there is a rebound around the 105.90 level and the uptrend line, the pair would need to overcome the moving averages around 106.05 – [..]

post-image

Technical Analysis – US 500 index sends recovery signals; buyers await above 100-SMA

Posted on September 14, 2020 at 10:15 am GMT

The US 500 stock index (cash) is in a recovery mode and ready to return above the 20-period simple moving average (SMA) in the four-hour chart after refusing to step below the 3,296 bottom. The RSI and the MACD have posted higher lows, indicating an improving short-term bias. However, any additional upside correction may not be attractive enough unless the index jumps above the 100-period SMA, which had strongly rejected the bulls early in August. The 50% Fibonacci of the [..]

post-image

Technical Analysis – AUDUSD moves horizontally above the bullish cross of SMAs

Posted on September 14, 2020 at 9:21 am GMT

AUDUSD is standing above the developing bullish crossover within the 20- and 40-period simple moving averages (SMAs), ready to insert back into the Ichimoku cloud in the four-hour chart. Also, the price has been trading above the rising trend line drawn from July 24 despite moving horizontally over the last couple of days.  The technical indicators are flattening, with the RSI holding marginally above its 50 level and the MACD remaining muted around its trigger line. An extension to the upside and above the upper surface of the Ichimoku cloud could meet the area around the [..]

Technical Analysis – EURUSD edges sideways; advances could be on the cards

Posted on September 14, 2020 at 8:17 am GMT

EURUSD is currently at a standstill, curbed by the 1.1695 and 1.2010 boundaries, though is still communicating an intact upside development in price that recently stretched slightly above the 1.2000 psychological number. The fresh bearish overlap within the Ichimoku lines is transmitting frailty in the positive momentum, while the rising simple moving averages (SMAs) reflect an unquestionable bullish tone. The short-term oscillators appear to be gaining strength again. The MACD, in the positive region, is below its red signal line [..]

Risk Warning: Your capital is at risk. Leveraged products may not be suitable for everyone. Please consider our Risk Disclosure.