XM does not provide services to residents of the United States of America.

Technical Analysis

post-image

Technical Analysis – EURGBP could provide the bulls a second chance

Posted on September 17, 2020 at 11:32 am GMT

EURGBP pulled back below the 0.9290 resistance for the second time this year but the bulls may have a second chance to retake control as the pair is exposed to a key supportive area. The 50% Fibonacci retracement of the 0.9497-0.8670 downleg is currently in action at 0.9080, blocking any additional negative correction. If it proves fragile, the descending trendline with the help of the 38.2% Fibonacci of 0.8980 could still keep the bulls on the surface if they manage to put [..]

Technical Analysis – AUDUSD’s stamina preserves bullish bearing     

Posted on September 17, 2020 at 8:56 am GMT

AUDUSD, in spite of its recent stalling, maintains a sturdy positive structure above the simple moving averages (SMAs) and the Ichimoku cloud. Aiding the climb is the intact bullish drive in the Ichimoku lines and the robustness of the upward sloping 50- and 100-day SMAs. The short-term oscillators illustrate the recent pause in the pair, reflecting the reduction in positive momentum. The MACD, in the positive area, is carefully shadowing below its red trigger line, while the RSI is weakening [..]

post-image

Technical Analysis – WTI futures test SMAs with weak momentum

Posted on September 17, 2020 at 8:34 am GMT

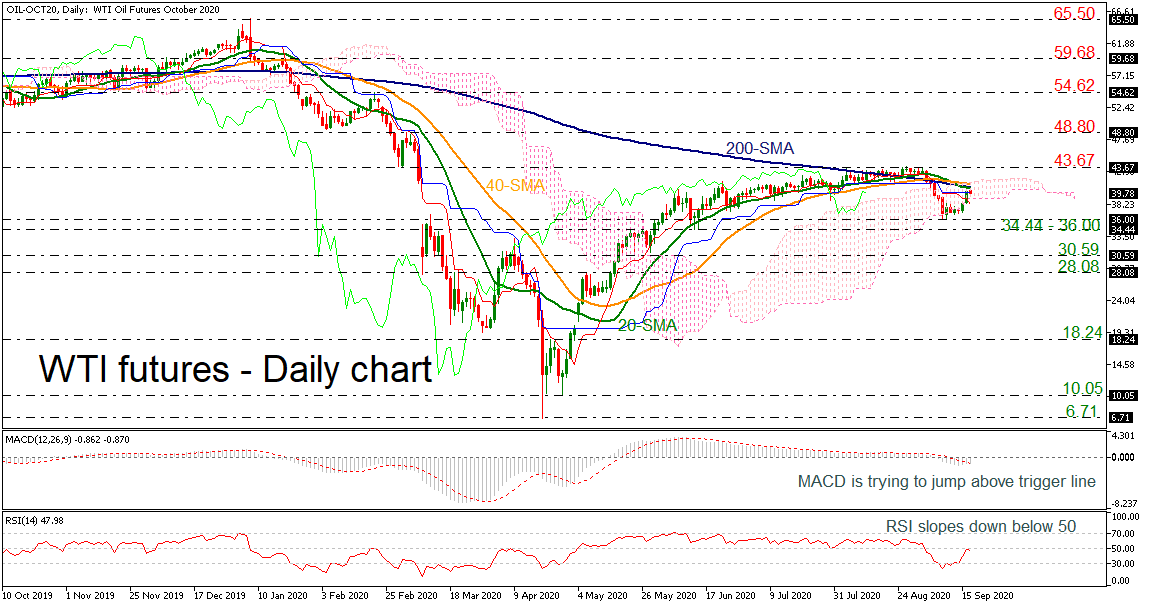
WTI crude oil futures have reversed back to the upside, flirting with the 200-day simple moving average (SMA) and the short-term MAs as well as the Ichimoku cloud. The price rebounded on the 36.00 psychological mark and the MACD oscillator posted a bullish crossover with its trigger line in the negative territory. Although the RSI challenged the 50 level, it failed to surpass it and is ticking down. An extension to the upside, climbing above the SMAs, immediate resistance could come from the 43.67 barrier. [..]

Technical Analysis – USDCHF exposed to a bullish trend reversal

Posted on September 17, 2020 at 7:44 am GMT

USDCHF’s sell-off seems to have found a bottom around its 5 ½-year low as the five-week old range looks to have transformed to an inverse head and shoulder pattern – a bullish signal that the price may change direction to the upside. However, this is not the only encouraging sign. In momentum indicators, the RSI has been printing higher highs and higher lows along an ascending trendline and is currently ready to cross back above its 50 neutral mark. Likewise, the MACD [..]

post-image

Technical Analysis – EURUSD plummets to 1-month low; neutral in bigger picture

Posted on September 17, 2020 at 7:06 am GMT

EURUSD plunged to a new one-month low of 1.1737, posting a spike below the strong barrier of 1.1753. The selling interest started after the pull back from the 1.1900 handle and the price declined beneath the simple moving averages (SMAs). The MACD is falling below its trigger and zero lines, however, the RSI is trying to turn north in the bearish zone. Should the pair stretch south, 1.1695 could provide immediate support before the pair touches the 1.1625 inside swing [..]

post-image

Technical Analysis – EURCHF retracts as negative sentiment sustains sideways pattern

Posted on September 16, 2020 at 3:02 pm GMT

EURCHF has recently receded below the 50-day simple moving average (SMA), determined to test the base of a near two-month persisting range. Negative sentiment appears to be prevailing in the short-term oscillators as well, despite the bullish bearing of the 50- and 100-day SMAs. The MACD is barely holding in the positive region but below its red trigger line, while the RSI has slipped into bearish territory. The stochastic lines appear tangled and remain in the oversold zone. If selling [..]

post-image

Technical Analysis – GBPJPY jumps higher, but still negative in near term

Posted on September 16, 2020 at 1:22 pm GMT

GBPJPY is advancing above the 20-period simple moving average (SMA) in the 4-hour chart, moving towards the significant 136.62 resistance level. The technical indicators are endorsing the recent upside run, with the MACD gaining ground above its trigger line and the RSI pointing north. An extension above the 136.62 key level could meet the area between the 23.6% Fibonacci retracement level of the down leg from 142.70 to 136.38 at 137.10 ahead of the 40-period SMA at 137.53. Further up, resistance [..]

post-image

Technical Analysis – EURGBP under negative strain; retraces to 38.2% Fibonacci

Posted on September 16, 2020 at 12:51 pm GMT

EURGBP dived towards the 0.9130 barrier, that being the 38.2% Fibonacci retracement of the up leg from 0.8865 to 0.9291, seeking to extend a deeper withdrawal from the recent 5½-month peak of 0.9291. The falling red Tenkan-sen line is fuelling the descent and could boost it with a bearish overlap of the blue Kijun-sen line. Additional negative backing is reflected in the short-term oscillators. The MACD, in the positive region, is decreasing below its red signal line, while the RSI [..]

post-image

Technical Analysis – USDCAD hits a ceiling around 1.3260

Posted on September 16, 2020 at 11:34 am GMT

USDCAD has been trending upwards over the last two weeks following the bounce off a fresh eight-month low of 1.2993. However, a strong resistance around the 1.3207 barrier has been a barrier to additional gains over the past week, shifting the spotlight back to the ascending trend line around 1.3150. The momentum indicators in the four-hour chart though are currently supporting the ongoing sideways move in the price. Specifically, the RSI is holding around the 50 level, while the stochastic is reversing lower after posting a bearish crossover within its %K [..]

Technical Analysis – USDJPY restrained, unable to break neutralizing shackles

Posted on September 16, 2020 at 8:15 am GMT

USDJPY continues to be robbed of directional momentum as the pair lingers, controlled by the 105.09 and 107.00 boundaries of a sideways pattern. The Ichimoku lines and the cloud propose minimal change in price action, while the drifting tone of the simple moving averages (SMAs) reflects little promise in assisting a new direction. Nonetheless, the short-term oscillators are slightly tilting towards an unfolding negative outcome. The MACD, in the negative region, has dipped below its red trigger line, while the [..]

Risk Warning: Your capital is at risk. Leveraged products may not be suitable for everyone. Please consider our Risk Disclosure.