XM does not provide services to residents of the United States of America.

Technical Analysis

post-image

Technical Analysis – Tesla’s stock poised for more recovery ahead of battery event

Posted on September 22, 2020 at 1:41 pm GMT

Tesla’s stock has been nicely recovering the downfall that followed the company’s stock split in late August, crawling above the Ichimoku cloud in the four-hour chart and back into the 400 territory. Today’s battery event in California is expected to bring exciting news according to the CEO Elon Musk and questions are rising about whether the stock can rally towards its recent record high of 501.50. From a technical perspective, the short-term bias is viewed as positive, reflected by the [..]

post-image

Technical Analysis – EURCHF resonates sideways towards supportive trend line

Posted on September 22, 2020 at 1:02 pm GMT

EURCHF has adopted a fairly horizontal demeanour for nearly two-months now and appears to be approaching a medium-term ascending trend line pulled from the 1.0505 low. The confused simple moving averages (SMAs) further reflect the directionless tone that has grasped the pair. The 50-period SMA has crossed below the steadied 200-period SMA, while the 100-period SMA has become fixed above it. The short-term oscillators reflect conflicting signals in sentiment. The MACD has dropped beneath its red signal line and the [..]

post-image

Technical Analysis – GER 30 index records worst day since June; structure remains unchanged

Posted on September 22, 2020 at 12:03 pm GMT

The German 30 stock index (cash) crashed by almost 4% on Monday, recording its worst daily session since June. The index tumbled below its 20- and 50-day simple moving averages (SMA), which have been curbing downside corrections from early August, and landed near the bottom of the Ichimoku cloud. The RSI also followed the price lower, crossing below its 50 neutral mark, while the MACD deviated below its red signal line, both pointing to a weaker trading in the short-term. That [..]

post-image

Technical Analysis – WTI futures stabilize near the cloud after selling pressure

Posted on September 22, 2020 at 11:30 am GMT

WTI crude oil futures had a strong selling interest over the previous, touching the 40-period simple moving average (SMA) and the Ichimoku cloud. The commodity found resistance at the 200-period SMA and the technical indicators are falling aggressively. The RSI is standing in the negative territory, while the MACD stands below the trigger line in the positive area. In the light of more negative pressures, initial tough support could develop from the 38.43 support before meeting the lower surface of the [..]

post-image

Technical Analysis – USDCAD rallies above 200-MA; positive signals emerge

Posted on September 22, 2020 at 9:14 am GMT

USDCAD is confronting the 1.3346 to 1.3360 resistance zone after the pair commenced actions to shift the short-term bias to positive, by rocketing above the 200-period simple moving average (SMA) and the previous spikes that tried to pierce above it, in the beginning of September. The upward sloping Ichimoku lines are assisting the climb, while the rising 50- and 100-period SMAs and the fresh bullish crossover of the 200-period SMA may reinforce the ascent. The short-term oscillators suggest improvements in [..]

Technical Analysis – GBPUSD increases the case of a downtrend in short-term

Posted on September 22, 2020 at 7:30 am GMT

GBPUSD erased last week’s upward correction and slipped slightly into the 1.2700 region, charting a lower high around the 50-day simple moving average (SMA) in the short-term picture. The recent bearish move follows the creation of a lower low at 1.2760 and hence increases the case of a downtrend. The 200-day SMA that has been flattening around the 1.2710  level for some time could be the next price to claim as the bearish bias is still intact. The MACD continues to expand to the [..]

Technical Analysis – EURJPY plunges to fresh 2-month low; breaks uptrend line

Posted on September 22, 2020 at 6:59 am GMT

EURJPY has been tumbling over the last couple of days, posting a fresh two-month low of 122.51. The 20- and 40-day simple moving averages (SMAs) are creating a bearish crossover, while the momentum indicators are losing ground. The MACD oscillator slipped beneath the trigger and zero lines and the RSI indicator is approaching the oversold zone. More downside pressures could lead towards the 38.2% Fibonacci retracement level of the up leg from 114.40 to 127.07 at 122.25, which overlaps with [..]

post-image

Technical Analysis – AUDUSD portrays brief horizontal tone after bounce on 200-MA

Posted on September 21, 2020 at 1:07 pm GMT

AUDUSD is tackling the lower Bollinger band coupled with the 200-period simple moving average (SMA) after recently dipping below the 50- and 100-period SMAs. The price seems temporarily stalled between the boundaries of 0.7246 and 0.7344, though sustaining a broader positive structure. The rising SMAs still convey a progressing picture despite a snag in the 50-period SMA. The short-term oscillators reflect fragile negative directional momentum, mirroring the recent fading in the price. The MACD has retraced below its red trigger [..]

post-image

Technical Analysis – US 500 index erases some gains; could weaken further in short-term

Posted on September 21, 2020 at 10:05 am GMT

The US 500 (Cash) index is diving towards the 23.6% Fibonacci retracement level of the up leg from the 39-month low of 2,183.95 to the record high of 3,588.24 at 3,260. The declining move over the last three consecutive days drove the market beneath the 50-day simple moving average (SMA) and the technical indicators are confirming the recent bearish mode. The MACD is falling slightly below the zero level, while the RSI is slipping below the 50 level. Steeper movements [..]

post-image

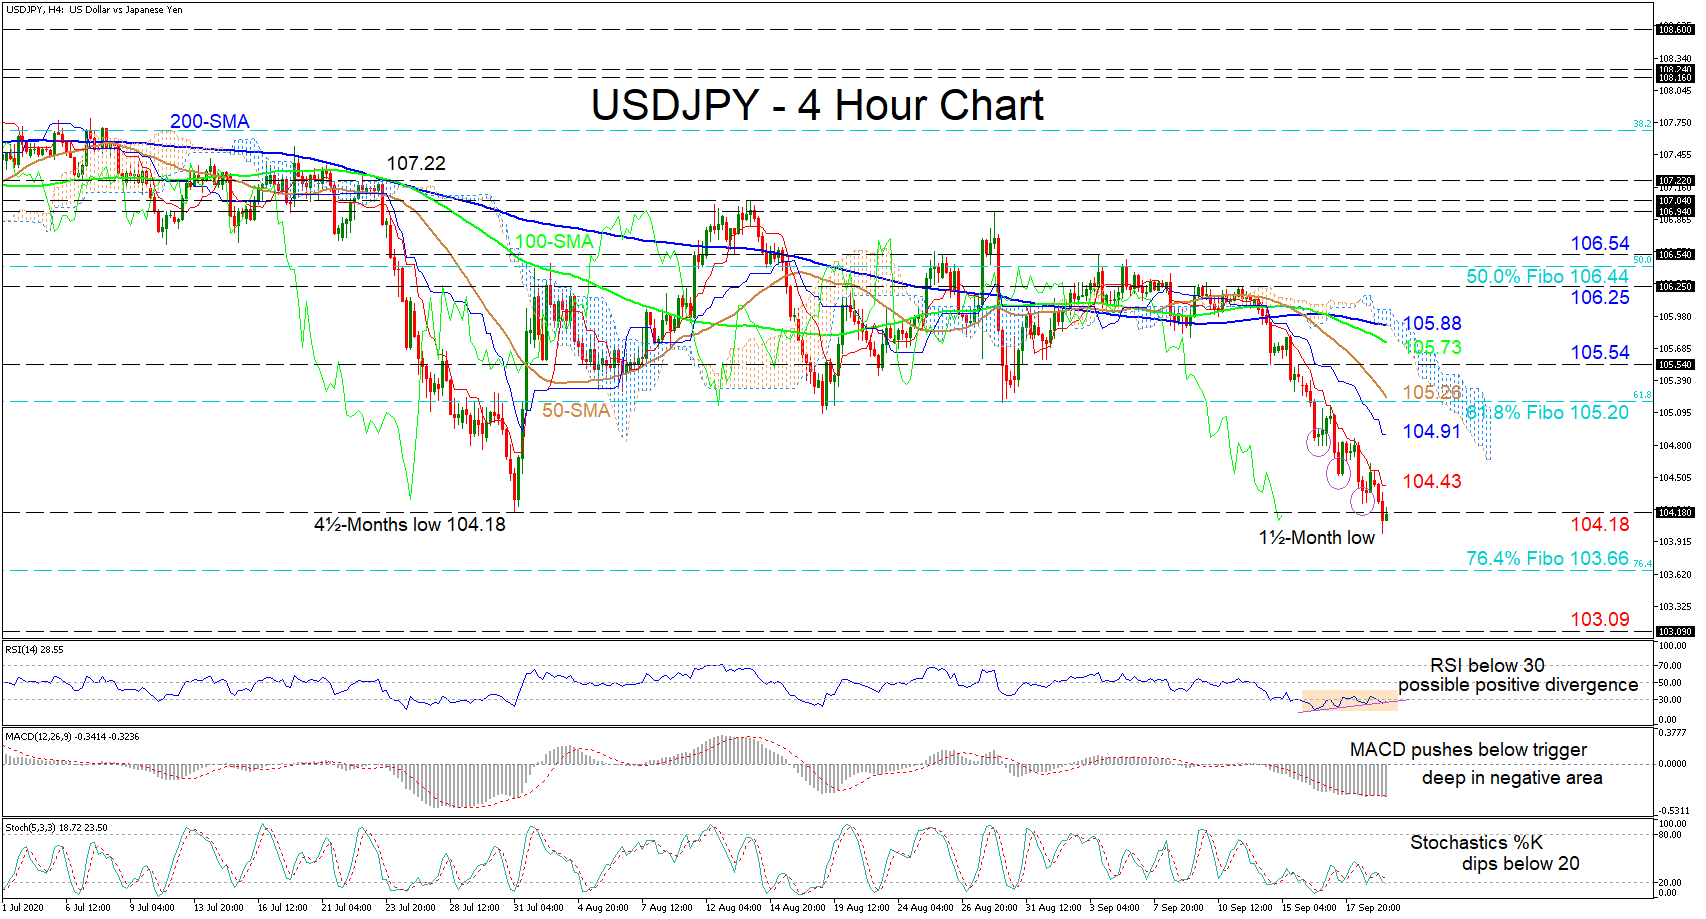
Technical Analysis – USDJPY struggles with critical support; negative pressures persist

Posted on September 21, 2020 at 9:23 am GMT

USDJPY has pierced below the vital 104.18 trough after the price plunged underneath its simple moving averages (SMAs), breaking the constraints of a short-term sideways market. The diving Ichimoku lines now maintain a strong bearish tone while the falling 50- and 100-period SMAs hold a dictating negative bearing, both suggesting further losses. The short-term oscillators are reflecting mixed signals in directional momentum. The MACD, far beneath zero, has nudged under its flattened red trigger line, while the RSI has bounced [..]

Risk Warning: Your capital is at risk. Leveraged products may not be suitable for everyone. Please consider our Risk Disclosure.