XM does not provide services to residents of the United States of America.

Technical Analysis

post-image

Technical Analysis – Boeing stock testing crucial support region

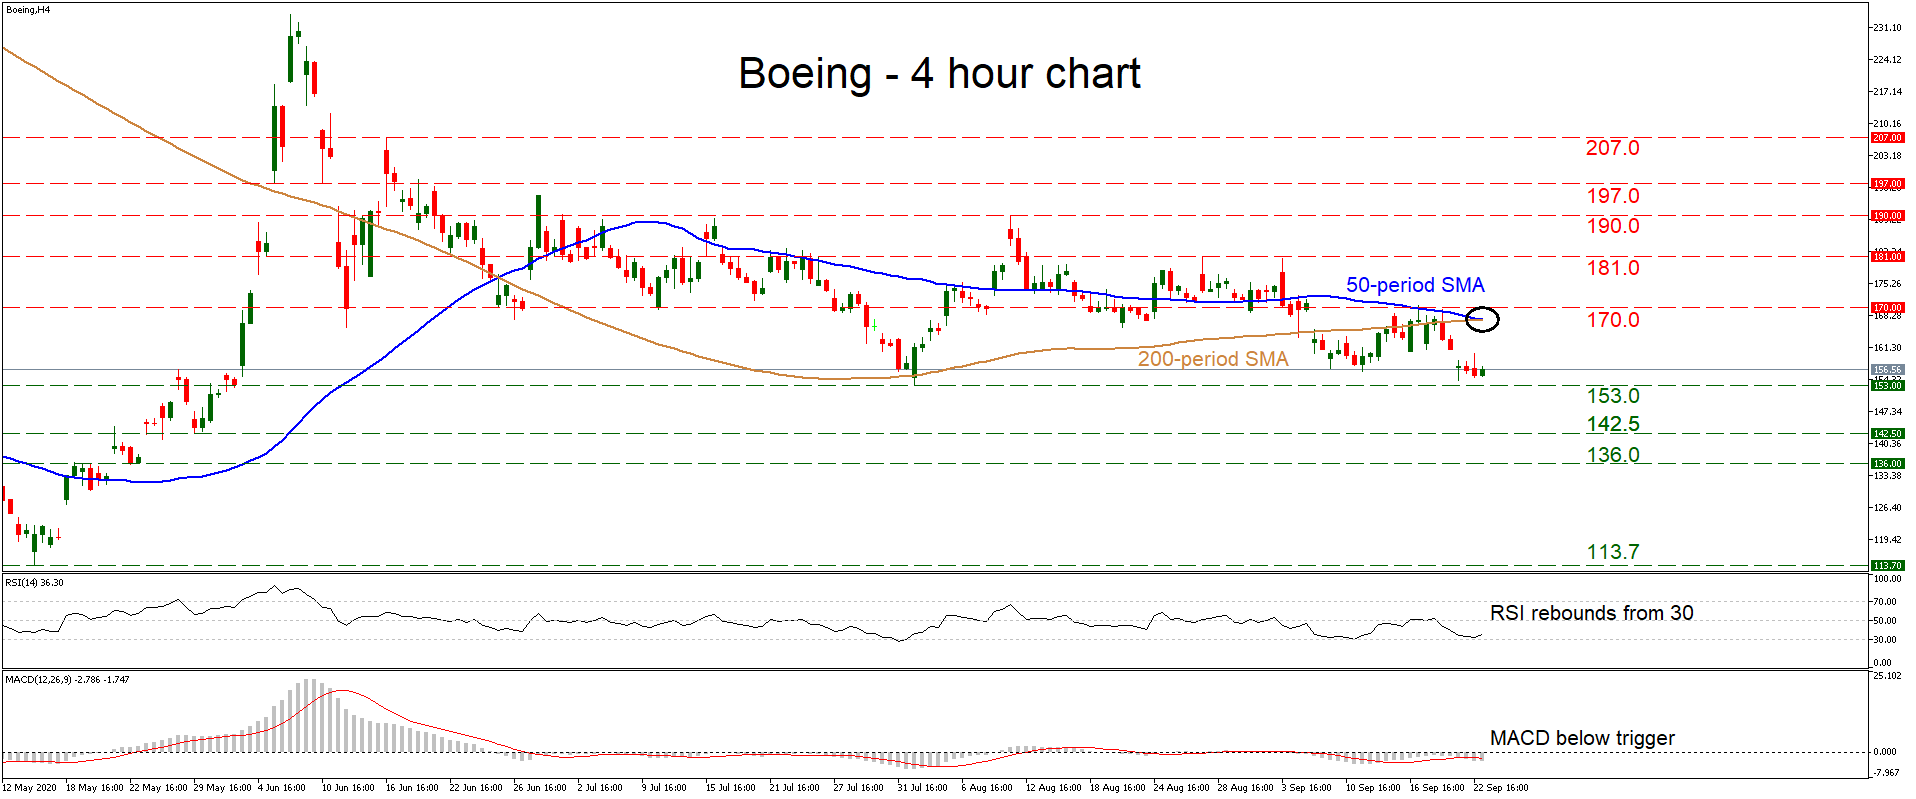
Posted on September 23, 2020 at 1:40 pm GMT

Boeing’s shares have been grinding lower since June, albeit in a slow and controlled manner. The short-term price structure looks cautiously negative, as the stock has been printing lower highs and is trading beneath its 50- and 200-period simple moving averages (SMAs) on the four-hour chart, which seem ready to post a ‘death cross’. The silver lining is that there hasn’t been a lower low, as the 153.0 support zone has held strong so far. Short-term oscillators reflect this mildly [..]

post-image

Technical Analysis – EURAUD rallies towards a fresh 1-month high

Posted on September 23, 2020 at 12:44 pm GMT

EURAUD spiked to a fresh one-month peak of 1.6440 earlier today. The price completed a double bottom formation after breaching the 1.6350 strong barrier, shifting the bias from bearish to bullish. Meanwhile, the stochastic oscillator is trying to post a bearish crossover in the overbought region, while the rising MACD continues to hold above its trigger and zero lines. The 1.6520 barrier is the nearest resistance that could reject any attempt higher. In case it fails to do so, and the price extends positive momentum, the 1.6550 [..]

post-image

Technical Analysis – GBPJPY slowing near 3-month lows; negative bearing intact

Posted on September 23, 2020 at 12:18 pm GMT

GBPJPY appears to have stalled its bearish trajectory ahead of the 132.93 border from July 1. The pause in the pair’s descent is also reflected in the short-term oscillators and the easing of the slopes of the negatively charged Ichimoku lines. The technical indicators are skewed to the downside despite displaying a slight improvement in momentum. The MACD, far below zero, has pushed above its red trigger line, while the RSI is pointing upwards after a bounce on the 30 [..]

post-image

Technical Analysis – Apple stock stabilizes after fierce correction

Posted on September 23, 2020 at 11:27 am GMT

Apple’s stock suffered a sharp drop in September, falling by more than 20% from its all-time highs before finding support near the 104.30 level and the lower Bollinger band. The price then rebounded somewhat, crossing back above the 50-day simple moving average (SMA), which is encouraging as it suggests this might have been just a correction after an explosive move higher since March. Momentum oscillators paint a mixed picture, with the RSI reflecting the latest recovery but the MACD continuing [..]

post-image

Technical Analysis – Silver crashes by 12%; next support within 23.00-22.20 area

Posted on September 23, 2020 at 11:08 am GMT

Sliver staged a dramatic decline of 12% this week after failing to close above the 20-day simple moving average (SMA). The sell-off has also pushed the price below the 50-day SMA and near the bottom of the Ichimoku cloud for the first time in three months, bringing the case for a downtrend forward. The momentum indicators are painting a gloomier short-term picture as well. The MACD has extended its weakness into the negative area, while the RSI is forcefully falling towards its 30 [..]

post-image

Technical Analysis – AUDJPY turns lower amid risk aversion, but stays in uptrend

Posted on September 23, 2020 at 9:35 am GMT

AUDJPY has been losing ground in September, pressured by a general deterioration in market sentiment. The pair has crossed below its 50-day simple moving average (SMA) for the first time since April, which is worrisome, but not enough to shatter the broader bullish picture. The daily price structure still consists of higher highs and higher lows, keeping the trend cautiously positive. A move below 72.70 and the 200-day SMA is required to change that. Short-term oscillators echo the latest move [..]

post-image

Technical Analysis – EURGBP seems to be looking for more recovery after dip in Ichimoku cloud

Posted on September 23, 2020 at 9:27 am GMT

EURGBP has been trading bullish in the short-term picture after ascending from the 0.9080 support, pushing the price above the 0.9200 handle, the simple moving averages (SMAs), and the Ichimoku cloud. The short-term oscillators reflect a slightly positive bias. The MACD, in the positive area, has moved marginally above its red trigger line but remains close to zero, while the RSI has been fluctuating above its neutral mark, pointing slightly up. Additionally, the 20- and 40-period SMAs are ready to confirm a bullish crossover, suggesting that the upside structure may improve. To the upside, the important [..]

post-image

Technical Analysis – Gold’s bearish drive accelerates; downward risks grow

Posted on September 23, 2020 at 7:39 am GMT

Gold is gaining negative momentum beneath the simple moving averages (SMAs) and the Ichimoku cloud, as reflected in the declining Ichimoku lines. The commodities’ recent break out of the sideways market is also receiving backing from the evolving bearish tone in the SMAs. The short-term oscillators further convey the descent in the precious metal. The MACD, in the negative region, is weakening below its red trigger line, while the RSI has dipped into oversold territory. Additionally, the descending stochastic lines [..]

Technical Analysis – NZDUSD bears meet 0.6600; selling pressure may continue

Posted on September 23, 2020 at 7:22 am GMT

NZDUSD had a steep decrease over the previous couple of sessions, challenging the 0.6600 psychological level. The pair fell beneath the six-month ascending trend line, opening the way for a potential neutral bias in the short-term. The momentum indicators are confirming the recent selling interest as the RSI slipped beneath its 50 level, while the stochastic oscillator dropped in the oversold zone. The 20- and 40-day simple moving averages (SMAs) are turning slightly lower and the 200-day SMA is flattening [..]

Technical Analysis – USDJPY strengthens downtrend in medium-term; oversold in short-term

Posted on September 23, 2020 at 7:18 am GMT

USDJPY added a new low at 103.99 to its downward pattern before bouncing up to the 105.00 territory, turning the six-month picture more bearish. Meanwhile, the fast stochastics, which have confirmed a bullish cross below the 20 oversold level and are sloping upwards now, are suggesting that the ongoing upside correction may continue in the short-term. The price itself is also hinting that the recent downward move is overstretched after testing several times the lower Bollinger band, with the rising [..]

Risk Warning: Your capital is at risk. Leveraged products may not be suitable for everyone. Please consider our Risk Disclosure.