XM does not provide services to residents of the United States of America.

Technical Analysis

post-image

Technical Analysis – USDJPY crowned by 200-MA; price appears static

Posted on October 5, 2020 at 12:08 pm GMT

USDJPY is struggling to push above the 200-period simple moving average (SMA) as directional momentum has dampened. The Ichimoku lines appear powerless in aiding the stagnant pair while the flattening out of the simple moving averages (SMAs) promotes additional sideways development. The MACD has improved marginally above zero and its red trigger line but remains around its neutral zone, while the RSI is losing pace in bullish territory. Moreover, the stochastics %K line is stalling in the overbought section but [..]

post-image

Technical Analysis – US 500 capped by 50-day SMA and Ichimoku cloud

Posted on October 5, 2020 at 9:27 am GMT

The US 500 index rebounded on the 3,200 handle and the 100-day simple moving average (SMA), shifting back to the upside. Currently, the price found resistance at the 50-day SMA and the upper surface of the Ichimoku cloud, while the red Tenkan-sen and the blue Kijun-sen line are moving horizontally. The MACD and the RSI are also heading sideways failing to support the upside movement. To the upside, emanating pressure over the last couple of days has denied upside moves. [..]

Technical Analysis – EURUSD consolidates under 50-day SMA; upside risks remain

Posted on October 5, 2020 at 7:52 am GMT

EURUSD is resting on the 1.1707 level, that being the 23.6% Fibonacci retracement of the up leg from 1.0726 to 1.2010, capped by the mid-Bollinger band. The simple moving averages (SMAs) command a bullish tone while the short-term oscillators convey mixed signals in directional momentum. The MACD and the RSI are transmitting a slight improvement in the pair with the MACD, in the negative region, pushing above its red trigger line and the RSI attempting to break above the 50 [..]

post-image

Technical Analysis – AUDUSD points marginally down but still above SMAs

Posted on October 5, 2020 at 7:42 am GMT

AUDUSD has been recovering nicely after the rebound on the two-month low of 0.7005, crawling back above the 20- and 40-period simple moving averages (SMAs). However, looking at the very short-term the price is ticking slightly down, dropping below 0.7200. From a technical perspective, the near-term bias is viewed as negative, reflected by the decline in the RSI and the MACD. The RSI is pointing down in the bullish area, the MACD is losing momentum below the trigger line and [..]

post-image

Technical Analysis – Gold short-term bias skewed to the downside; long-term uptrend intact

Posted on October 5, 2020 at 7:39 am GMT

Gold opened on the negative side on Monday, unable to remove the barrier around the 38.2% Fibonacci of the 1,670-2,079 upleg and stretch into the 1,900 zone. The 20-day simple moving average (SMA) also happens to be in the neighbourhood, adding extra importance to the region. In the short-term picture, the metal pierced the previous low from August 12, marginally though, before bouncing up, while the 20- and the 50-day SMAs have recently posted a bearish cross, creating speculation that the downward direction may be extended. [..]

post-image

Technical Analysis – NZDUSD finds footing on mid-Bollinger band

Posted on October 2, 2020 at 12:30 pm GMT

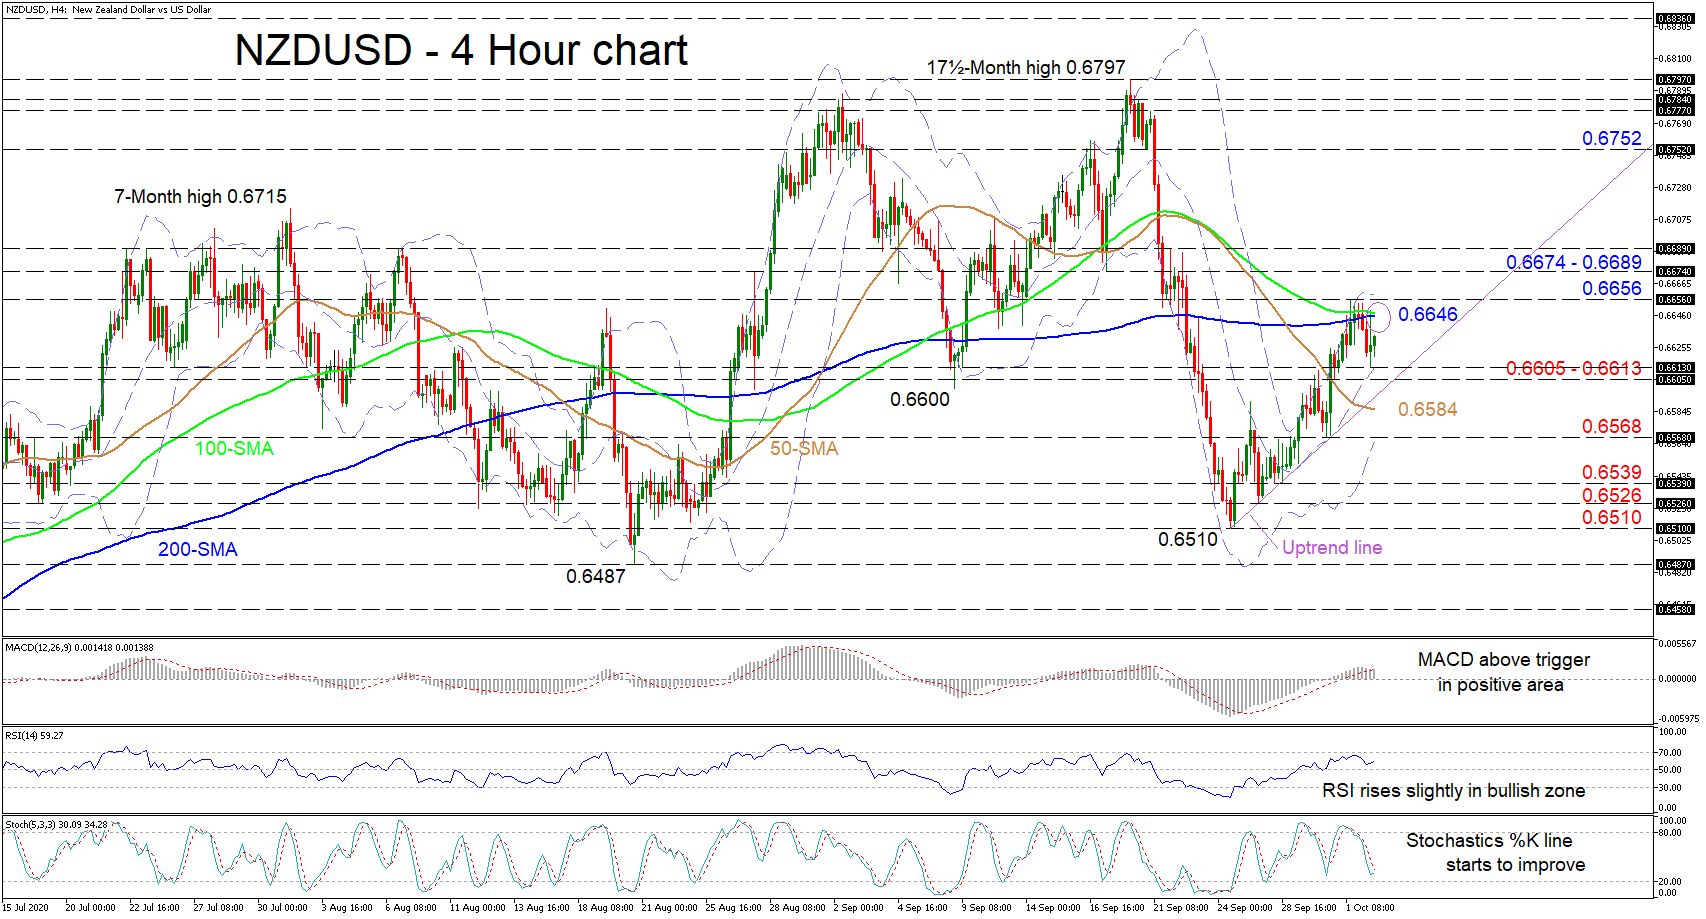
NZDUSD found some traction on the mid-Bollinger band currently at 0.6613, after a pullback returned the pair underneath the 100- and 200-period simple moving averages (SMAs). Furthermore, the short-term ascent is holding above the uptrend line drawn from the 0.6510 mark. The short-term oscillators suggest increasing momentum. The MACD, in the positive area, is above its red signal line, while the RSI is beginning to climb in bullish territory. The stochastic oscillators’ negative tone is waning as the %K line [..]

post-image

Technical Analysis – US 30 index declines after Trump tests positive for Covid-19

Posted on October 2, 2020 at 9:45 am GMT

The US 30 (cash) index declined below the 50-day simple moving average (SMA), continuing the selling correction from the 29,210 resistance. From a technical perspective, the MACD is moving sideways near the zero level, while the RSI is pointing down below the 50 level. More downside movements could send the price until the next support, which is the 23.6% Fibonacci retracement level of the upward wave from 18,145 to 29,210 at 26,571. Below this level, the 200-day SMA at 26,253 [..]

post-image

Technical Analysis – GBPJPY holds below SMAs; looks to consolidate

Posted on October 2, 2020 at 8:29 am GMT

GBPJPY recently pivoted at the 133.03 mark and appears to have started what seems like a sideways market. The simple moving averages (SMAs) are somewhat converging, supporting this view. Additionally, the weakening negative charge within the Ichimoku lines and the cloud are aiding a shift into a horizontal formation. The short-term oscillators’ mixed signals also give the impression of undecided directional momentum. The MACD, in the negative region, is increasing above its red trigger line, while the RSI has deflected [..]

Technical Analysis – USDCAD ticks up after downfall from descending line

Posted on October 2, 2020 at 7:40 am GMT

USDCAD is pointing slightly up after the strong downfall from the upper surface of the Ichimoku cloud and the falling trend line around 1.3420. The 20- and 40-day simple moving averages (SMAs) created a bullish crossover near the 1.3250 barrier suggesting an upside pullback in the short-term. The MACD oscillator is flattening in the positive territory, while the RSI is ticking up near 50. The negative bias in the medium-term is still in place and if there is a successful [..]

post-image

Technical Analysis – EURUSD’s climb hits a snag; 100-day SMA caps advances  

Posted on October 1, 2020 at 9:50 am GMT

EURUSD is finding difficulty in breaking above the Ichimoku cloud’s ceiling that is joined by the 100-period simple moving average (SMA) around 1.1769. Recently restored positive sentiment from the 1.1611 level appears to be aided by the rising 20-period SMA and the positive tone of the Ichimoku lines. However, the short-term oscillators reflect mixed signals in direction. The MACD, in the positive area, is slightly above its red trigger line while the stochastic oscillator holds a positive bearing. Meanwhile, the [..]

Risk Warning: Your capital is at risk. Leveraged products may not be suitable for everyone. Please consider our Risk Disclosure.