XM does not provide services to residents of the United States of America.

Technical Analysis

post-image

Technical Analysis – EURJPY pushes off 100-day SMA; maintains bullish influence

Posted on October 20, 2020 at 8:37 am GMT

EURJPY, although turning higher from the 100-day simple moving average (SMA) at 123.51, appears to be steering into a sideways market. The fairly flattened slopes of the 50- and 200-day SMAs are piloting a more horizontal price formation, while the intact bullish bias in the SMAs and the rising 100-day one are upholding the positive structure. The short-term oscillators are reflecting a pickup in positive momentum. The MACD has merged with its red signal line marginally below the zero mark, [..]

Technical Analysis – GBPUSD holds beneath 1.3000; slightly bearish in short term

Posted on October 20, 2020 at 7:01 am GMT

GBPUSD has reversed back down again after finding resistance at the 1.3080 level and the 1.3000 psychological mark, being the 23.6% Fibonacci retracement level of the up leg from 1.1409 to 1.3487. The momentum indicators are pointing to a neutral bias in the short term with the RSI holding near the 50 level and the MACD oscillator is moving sideways around the zero level. Also, the price is holding within the 20- and 40-day simple moving averages (SMAs) and the [..]

post-image

Technical Analysis – AUDUSD barely recovers; looks to develop sideways

Posted on October 19, 2020 at 1:19 pm GMT

AUDUSD has adopted a positive trajectory, improving slightly after pivoting at the 0.7055 low. The rising red Tenkan-sen line and the strengthening technical indicators endorse additional positive price action. Yet, the weakened slopes of the simple moving averages (SMAs) and their converging bearings are sponsoring an evolving horizontal picture. The short-term oscillators reflect a slight increase in positive momentum. The MACD, some distance below zero, is rising above its red trigger line, while the RSI is struggling to reach the [..]

post-image

Technical Analysis – USDJPY faces bearish risks inside descending channel

Posted on October 19, 2020 at 12:40 pm GMT

USDJPY pulled back from the 40-period simple moving average (SMA) and the upper bound of the descending channel in the previous couple of sessions. The short-term risk seems to be to the downside as the price is ready to cross below the Ichimoku lines and the RSI is pointing south in the negative territory. However, the MACD is gaining some ground above its trigger line, although it is still developing in the bearish area. Further losses could lead the market towards the 104.92-105.02 [..]

post-image

Technical Analysis – US 500 index safe and sound above trendline

Posted on October 19, 2020 at 9:37 am GMT

The US 500 stock index is trimming its latest downfall in the four-hour chart after landing again on the ascending trendline and near its 50-period simple moving average (SMA). Technically, the short-term bias is set to switch back to bullish as the price is trying to strengthen above its 20-period SMA, while the RSI and the MACD are also pushing efforts to gain momentum above their neutral levels. A decisive close above the 3,500 level followed by a run towards the 3,533-3,549 resistance region [..]

Technical Analysis – EURUSD fails to improve bullish bias; indicators are weak

Posted on October 19, 2020 at 8:26 am GMT

EURUSD has been in a slightly descending movement after the break below the rising channel in the previous month. Currently, the price is capped by the short-term simple moving averages (SMAs) and the red Tenkan-sen and the blue Kijun-sen lines. The RSI indicator fell below the neutral threshold of 50, while the MACD is flattening around the zero line, failing to signal a clear direction on price. If the price continues to move lower, immediate support is coming from the 1.1687 level, which [..]

Technical Analysis – Gold ranges between 50 and 100 SMAs; momentum feeble

Posted on October 19, 2020 at 8:14 am GMT

Gold seems to be adopting a sideways pattern after retreating under the Ichimoku cloud. The guiding and constricting 50- and 100-day simple moving averages (SMAs), as well as the horizontal Ichimoku lines, further back the suspended picture of the commodity. The short-term oscillators suggest a frozen state of directional momentum. The MACD, in the negative region, is holding above its red signal line but slightly below its zero mark, while the RSI is zig zagging around its neutral threshold. A [..]

post-image

Technical Analysis – AUDJPY puts breaks on losses; bullish bias expected above 74.86

Posted on October 19, 2020 at 8:02 am GMT

AUDJPY paused last week’s sell-off at 74.24 and above September’s trough of 73.96, reviving some hopes that a downtrend could be avoided. In the four-hour chart, the pair is currently testing the 20-period simple moving average (SMA) within the 74.00 territory as the MACD keeps distancing itself above its red signal line and the RSI continues to recover towards its 50 neutral mark. Despite the above encouraging signals, the bulls may not take the helm yet unless the price breaks [..]

post-image

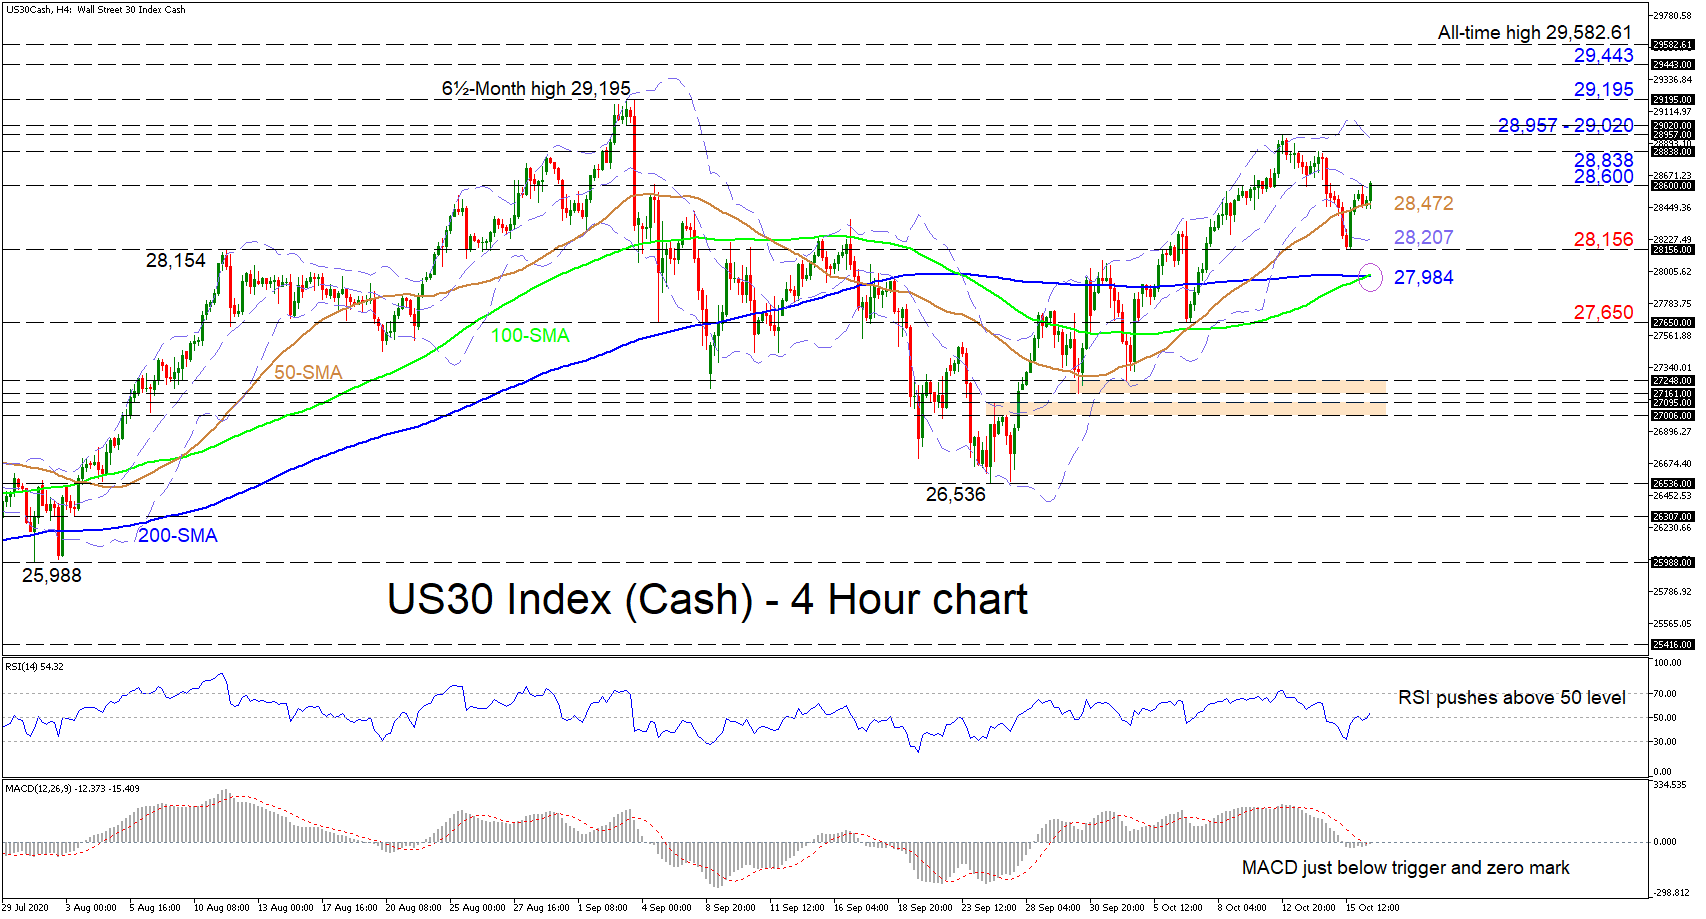
Technical Analysis – US 30 index struggles at mid-Bollinger band; positive signals grow

Posted on October 16, 2020 at 12:42 pm GMT

US 30 stock index (Cash) after having pushed above the 50-period simple moving average (SMA) is now confronting the mid Bollinger band at the 28,600 barrier. The index appears to be regaining strength after a pivot back up from the 28,156 mark. The rising slopes of the 50- and 100-period SMAs and the recent bullish crossover of the 200-period SMA by the 100-period one may boost the short-term uptrend. The short-term oscillators also reflect increasing positive momentum. The MACD, slightly [..]

post-image

Technical Analysis – GBPUSD pares losses after getting caught in another Brexit storm

Posted on October 16, 2020 at 12:18 pm GMT

GBPUSD swung by about 100 pips on Friday, setting an upper boundary around 1.2960 and a floor at 1.2860. The momentum indicators in the 4-hour chart are pointing to a mixed bias in the near term. The %K line of the stochastic oscillator continues to climb out of oversold territory and is positively sloped with the %D line, suggesting there is still some upside left in the pair after today’s erratic moves. But looking at the RSI, which is heading [..]

Risk Warning: Your capital is at risk. Leveraged products may not be suitable for everyone. Please consider our Risk Disclosure.