XM does not provide services to residents of the United States of America.

Technical Analysis

post-image

Technical Analysis – US 500 index sets the stage for bullish moves

Posted on November 2, 2020 at 10:06 am GMT

The US 500 index (cash) found key support at 3,260, being the 23.6% Fibonacci retracement level of the up leg from 2,183.95 to 3,588.24 over the last couple of days. After the strong negative sessions in the preceding month, the index is trying to gain some ground with the RSI indicator sloping marginally up and the %K line of the stochastic oscillator, creating a bullish crossover with the %D line in the oversold territory. Upsides moves are likely to find resistance at the 200-day [..]

post-image

Technical Analysis – AUDUSD’s picture dampens; scale looks to tip negative

Posted on November 2, 2020 at 9:57 am GMT

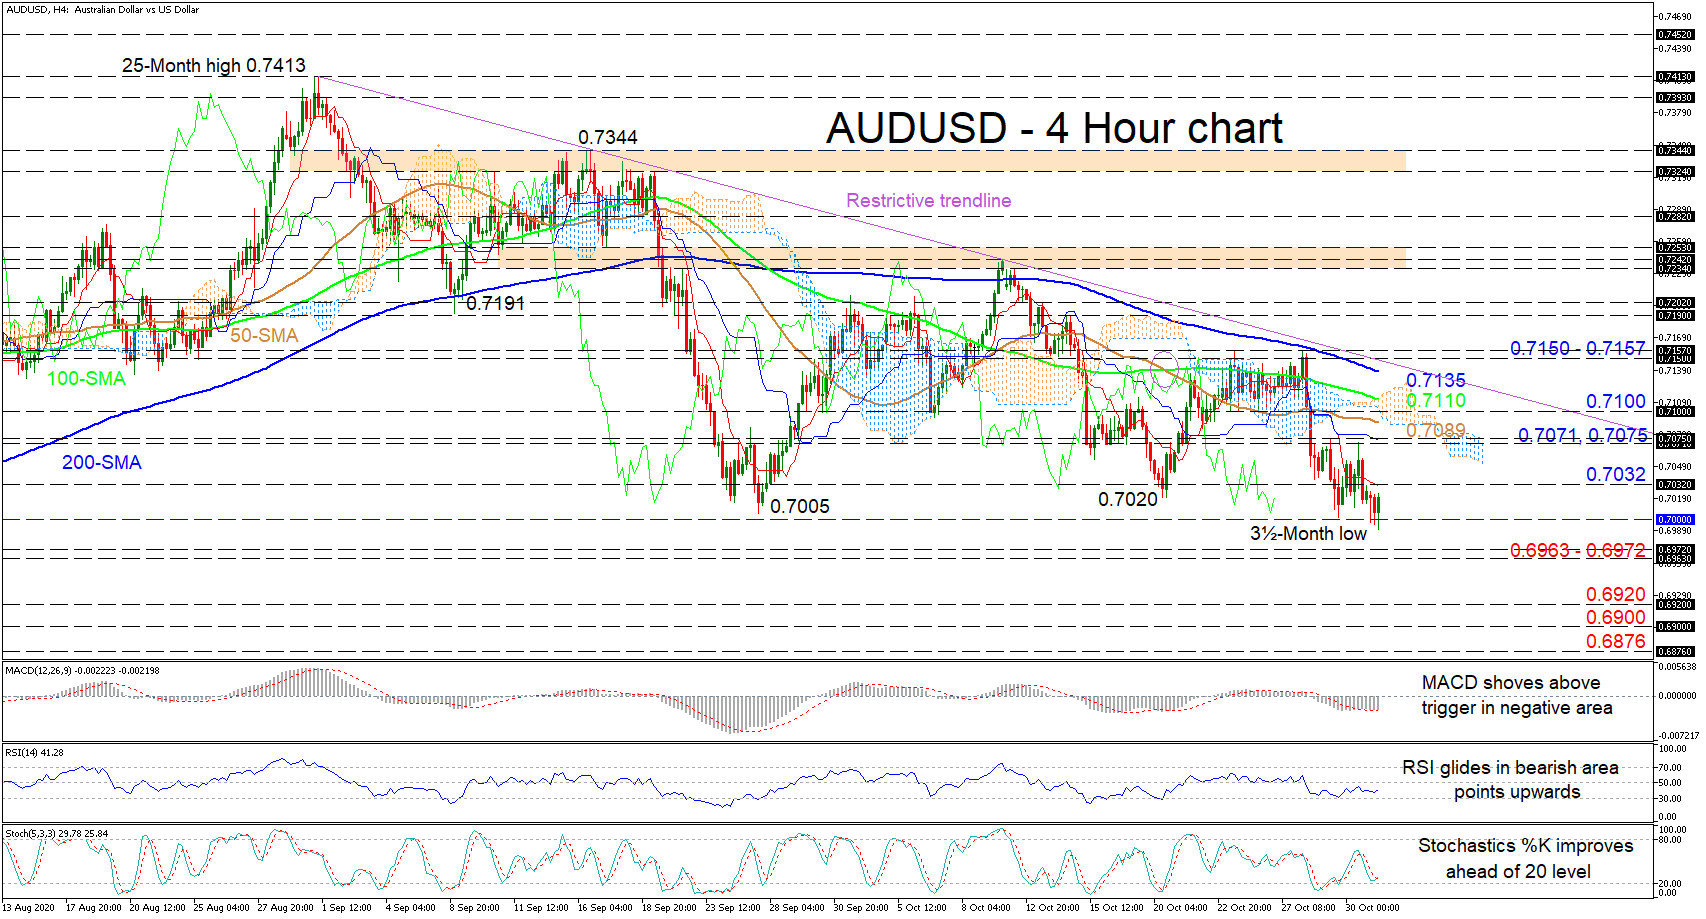
AUDUSD is currently pushing off the 0.7000 handle after the curbing 200-period simple moving average (SMA) plunged the pair underneath the 50- and 100-period SMAs, the Ichimoku cloud, and the 0.7020 and 0.7005 supporting troughs. The steady downward slopes of the SMAs and the bearish demeanour of the Ichimoku lines sponsor further fading in the pair. The short-term oscillators express conflicting signals of momentum but are leaning slightly towards the downside. The MACD, in the negative region, has marginally pushed [..]

Technical analysis – EURUSD battles with the bearish trend; major support at 1.1611

Posted on November 2, 2020 at 9:00 am GMT

EURUSD found new sellers below its simple moving averages (SMAs), stretching the pullback from the bottom of the ascending channel slightly below the Ichimoku cloud and towards September’s trough of 1.1611. The downward-sloping RSI combined with a bearish MACD, which has snapped below its signal and zero lines, is indicative of a strengthening bearish bias. Meanwhile, the red Tenkan-sen line is also set for a bearish crossover with the blue Kijun-sen, adding to the discouraging signals. Still, the wall around [..]

Technical Analysis – Gold declines further below short-term SMAs

Posted on November 2, 2020 at 8:02 am GMT

Gold prices have been in a slightly descending mode after they reached the 2,076.64 barrier in August. The price is currently holding beneath the 20- and 40-day simple moving averages (SMAs) and the Ichimoku cloud. The MACD oscillator is confirming this bearish bias as it stands beneath its trigger line, however, the RSI is pointing marginally up in the negative territory. Immediate support could come from the 1,847 level before the bears drive the yellow metal even lower towards the [..]

post-image

Technical Analysis – JP 225 index plunges under MAs; negative risks linger

Posted on October 30, 2020 at 1:29 pm GMT

Japan 225 stock index (cash) has improved slightly from the one-month low of 22,874 despite unbroken negative forces. The intact negative bearing of the Ichimoku lines and the downward sloping simple moving averages (SMAs) are supporting further deterioration in the price. Moreover, the approaching bearish crossover of the 200-period SMA by the 50-period one may additionally boost negative price action. The short-term oscillators, although in negative territories, reflect the recent progress in the index. The MACD, deep in the negative [..]

post-image

Technical Analysis – NZDUSD rebounds off lower bound of ascending channel

Posted on October 30, 2020 at 10:16 am GMT

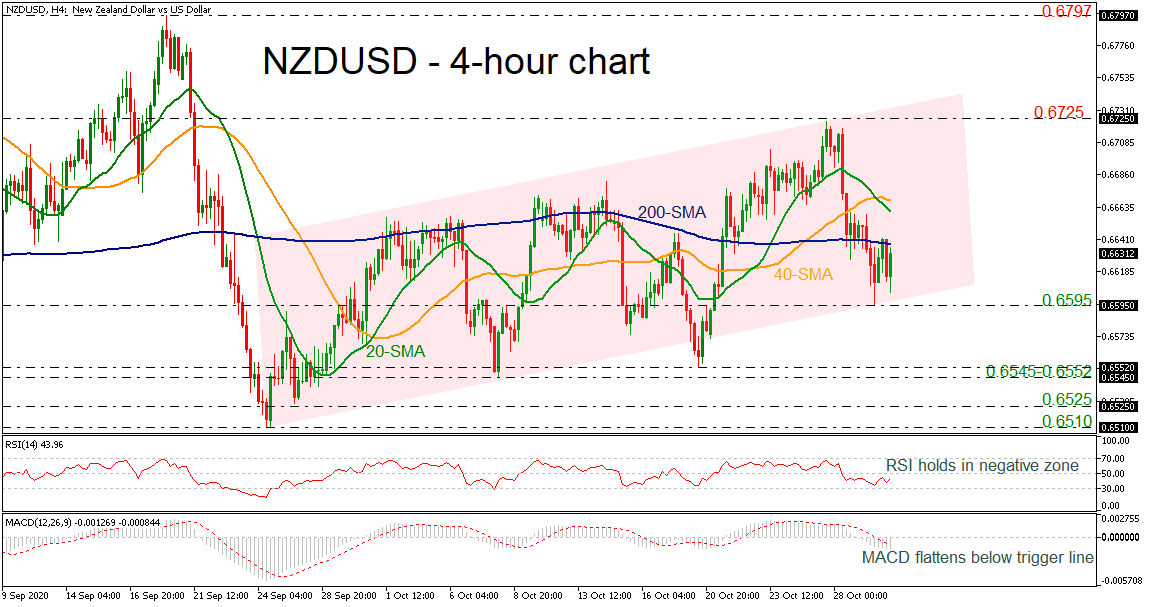
NZDUSD is holding beneath the 200-period simple moving average (SMA) inside the upward sloping channel in the 4-hour chart. In momentum indicators, the RSI is sloping slightly up in the negative territory, while the MACD is moving sideways below the zero level, framing a neutral-to-bearish bias . Should bullish dynamics dominate, the market might revisit the 20- and 40-period SMAs at 0.6660 and 0.6670 respectively. Above them, the area around 0.6725, which halted bullish movements in the past, could be another barrier in focus, while a [..]

Technical Analysis – USDCAD struggles as advances restricted by 100-MA

Posted on October 30, 2020 at 9:10 am GMT

USDCAD appears to be developing a neutral-to-bearish pattern as its recent progress from 1.3080 seems is being supressed by the 100-day simple moving average (SMA).  The stifled Ichimoku lines and the dwindling downward pace of the 50- and 100-day SMAs are aiding this view. The short-term oscillators currently reflect improving positive momentum. The MACD is strengthening above its red trigger and zero line, while the RSI is making attempts to sustain a positive trajectory towards the 70 level. However, the [..]

Technical Analysis – GBPJPY set for another red day; 133.00 could be the next target

Posted on October 30, 2020 at 8:48 am GMT

GBPJPY is printing its eighth consecutive red tiny candle following its second rejection from the 50-day simple moving average (SMA). The price has slipped below the 38.2% Fibonacci retracement of the 124.00 – 142.69 upleg, and there appears no key obstacle in sight to prevent the decline from reaching the 50% Fibonacci of 133.30 as the RSI continues to decelerate towards its 50 neutral mark. The MACD is also gaining negative momentum, while the red Tenkan-sen is set to cross [..]

post-image

Technical Analysis – GBPUSD declines further in short-term outlook

Posted on October 30, 2020 at 8:08 am GMT

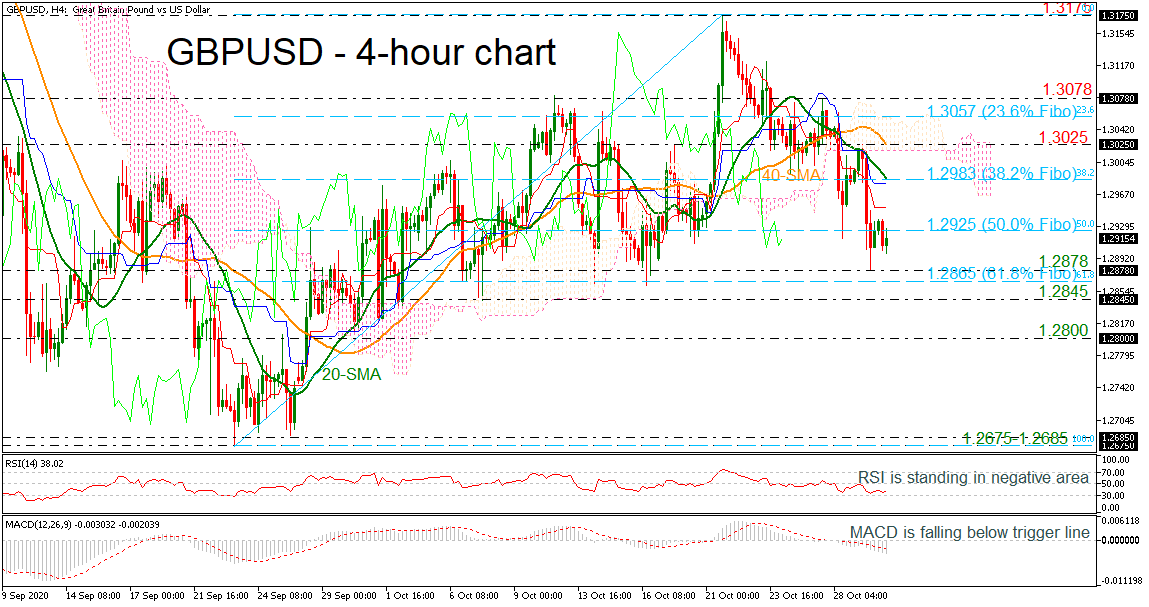
 GBPUSD started a deep fall after the pull back on the 1.3175 resistance level, taking the pair below the simple moving averages (SMAs) and the 50.0% Fibonacci retracement level of the up leg from 1.2675 to 1.3175 at 1.2925. From a technical viewpoint, the RSI is holding in the negative zone, while the MACD is extending its bearish movement below its trigger and zero lines. Also, the Ichimoku cloud and the red Tenkan-sen and blue Kijun-sen lines are suggesting a neutral to [..]

post-image

Technical Analysis – Gold fades below capping MAs; sideways tone remains

Posted on October 29, 2020 at 3:58 pm GMT

Gold was recently redirected downwards by its congested simple moving averages (SMAs), neutralising the gradual one-month incline from 1,848. The fairly sideways demeanour of the SMAs over the last month, endorses the commodity’s neutral tone between the boundaries of 1,845 and 1,933. The short-term oscillators convey opposing signals in directional momentum. The MACD is declining below its red trigger line in the negative region, while the downward sloping RSI is flirting with the 30 mark. The stochastic oscillator maintains a [..]

Risk Warning: Your capital is at risk. Leveraged products may not be suitable for everyone. Please consider our Risk Disclosure.