XM does not provide services to residents of the United States of America.

Technical Analysis

post-image

Technical Analysis – WTI futures’ pullback finds traction off 200-MA

Posted on November 10, 2020 at 3:21 pm GMT

WTI futures are confronting the 41.00 handle after finding a foothold on the 200-period simple moving average (SMA). The bearish demeanour of the SMAs looks to be fading, while the rising 50-day SMA is assisting the commodity’s bounce off the 200-day SMA. The short-term oscillators are currently transmitting an increase in positive momentum. The MACD, some distance in the positive region, is rising above its red trigger line, while the RSI is retesting the 70 mark. Moreover, the %K line [..]

post-image

Technical Analysis – USDCAD crawls near 20-period SMA; continues to recover

Posted on November 10, 2020 at 2:40 pm GMT

USDCAD has been nicely recovering the downfall followed that took place in late October, crawling near the 20-period simple moving average and back into 1.3000 territory. From a technical perspective, the very short-term bias is viewed as positive, reflected by the improvement in the RSI and the MACD. The increasing distance between the red Tenkan-sen and blue Kijun-sen lines is another bullish signal. Yet only a decisive close above the resistance of 1.3108, can boost buying pressure towards the 200-period [..]

post-image

Technical Analysis – EURCHF spikes around 1.0800; indicators look overbought

Posted on November 10, 2020 at 9:43 am GMT

EURCHF is still stretching the positive move after the sharp rally on Monday, surpassing the 1.0800 psychological level. Also, the pair climbed beyond the 200-period simple moving average (SMA), shifting the bearish bias to bullish. However, the RSI and the MACD seems to be overbought, suggesting a possible downside correction. Immediate resistance could come from the 1.0815 barrier, identified on September 30 ahead of the 1.0830 powerful level. Surpassing these lines, the 1.0850 high and the 1.0876 spike, achieved on [..]

Technical Analysis – EURJPY shifts sideways as resistance ceiling blocks gains

Posted on November 10, 2020 at 9:22 am GMT

EURJPY was overwhelmed by buying interest yesterday that thrusted the pair back above the 100- and 50-day simple moving averages (SMAs). Yet, advances hit a wall and the pair now seems to be steering into a more sideways structure. The minor upward inclines of the 100- and 200-day SMAs are preserving the positive picture, while the falling 50-day SMA promotes negative sentiment. The short-term oscillators also reflect the pair’s recent freeze in positive momentum. The MACD, in the negative region, [..]

Technical Analysis – GBPUSD could see further increases above 1.3180

Posted on November 10, 2020 at 7:57 am GMT

GBPUSD has been trading in an upward sloping channel over the last seven weeks, trying to surpass the 1.3180 resistance level. Technically, the price is still holding above the bullish crossover within the 20- and 40-day simple moving averages (SMAs) as well as beyond the Ichimoku cloud. The RSI indicator is standing in the positive territory and it looks ready to move towards the overbought area. However, the MACD oscillator is ticking marginally up above its trigger and zero lines. [..]

post-image

Technical Analysis – US 500 index skyrockets to new all-time high

Posted on November 9, 2020 at 3:14 pm GMT

US 500 index (Cash) abruptly propelled off the 3,550 mark today, stretching towards a fresh all-time high of 3,674 just above the 3,670 level, that being the 138.2% Fibonacci extension of the down leg from 3,550 until 3,233. The index is currently withdrawing from the new peak, though the Ichimoku lines maintain their strong bullish tone.  Moreover, a nearing positive overlap of the 200-period simple moving average (SMA) by the rising 50-period SMA, and the upturn in the adjacent 100-period [..]

post-image

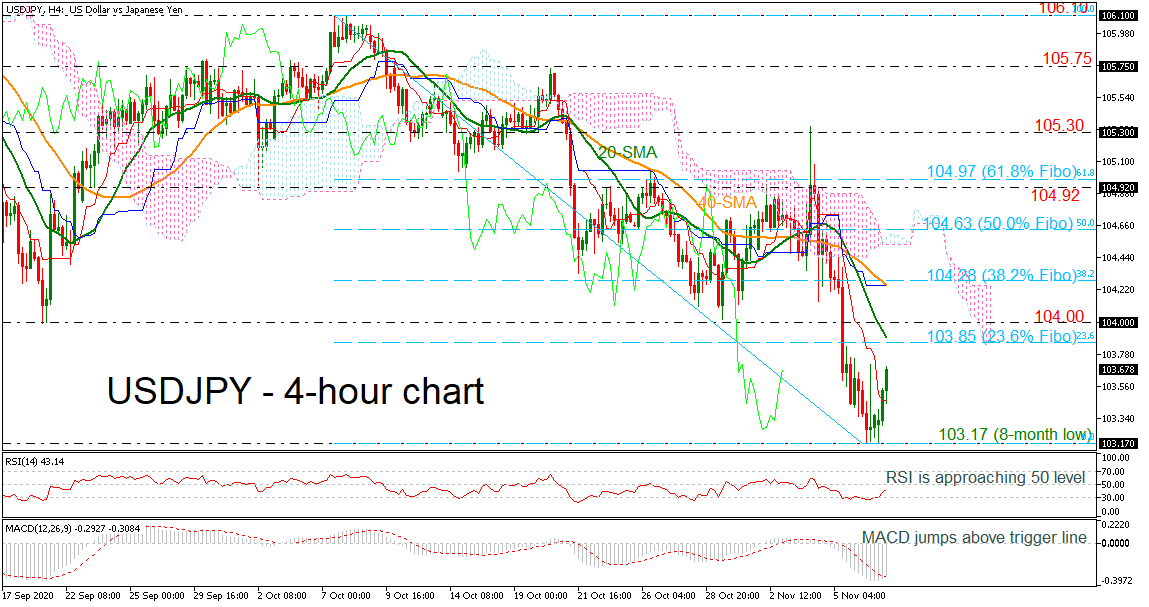
Technical Analysis – USDJPY pulls back from 8-month low

Posted on November 9, 2020 at 10:20 am GMT

USDJPY is reversing slightly higher after the aggressive sell-off in the preceding sessions towards the fresh eight-month low of 103.17. From the technical viewpoint, the RSI is ticking up in the negative territory, while the MACD posted a bullish crossover with its trigger line below the zero level. The 20- and 40-period simple moving averages (SMAs), though note that the red Kijun-sen line is flat and the blue Tenkan-sen also appears to be flatlining. If the bulls manage to hold control, then [..]

post-image

Technical Analysis – Gold tackles consolidation’s top frontier; drive frail

Posted on November 9, 2020 at 9:11 am GMT

Gold appears shackled as it is struggling to break above the cloud’s ceiling, which coincides with the roof of the two-and-a-half-month ranging market. In spite of the dwindling 50-day simple moving average (SMA), the SMAs defend the broader dictating bullish tone. The near-term gradual fading of the 50-day SMA and the directionless Ichimoku lines promote the commodity’s neutral demeanour. The short-term oscillators maintain a positive attitude despite flimsy sentiment. The MACD is above its red trigger line and the zero [..]

Technical Analysis – EURUSD surges near 1.1900 in consolidation area

Posted on November 9, 2020 at 7:54 am GMT

EURUSD is rallying above the previous high of 1.1880, creating four straight bullish days after the bounce off the 1.1611 support level. The price also jumped above the 20- and 40-period simple moving averages (SMAs) and the Ichimoku cloud, signaling some more buying interest. Technically, the RSI is confirming the positive outlook as it approaches the overbought territory, while the stochastic is holding above the 80 level suggesting a retracement in the short-term. If the market picks up more speed, [..]

post-image

Technical Analysis – GBPUSD’s hike ceases around upper Bollinger band     

Posted on November 6, 2020 at 1:30 pm GMT

GBPUSD is consolidating beneath the 1.3175-1.3183 limiting border after surging off the 200-period simple moving average (SMA) and above the 50- and 100-period averages. The fairly horizontal bearing of the SMAs are promoting the neutral picture. That said, the price is currently near the upper Bollinger band and is showing some signs of weakness. The short-term oscillators reflect the stall in positive price action. The MACD is in the positive region and above its red trigger line but looks to [..]

Risk Warning: Your capital is at risk. Leveraged products may not be suitable for everyone. Please consider our Risk Disclosure.