XM does not provide services to residents of the United States of America.

Technical Analysis

post-image

Technical Analysis – USDCHF stands in descending channel in near term

Posted on November 26, 2020 at 2:20 pm GMT

Technical Analysis – USDCHF stands in descending channel in near term USDCHF registered losses for the second week in a row, dropping to a more than two-week low of 0.9063 today and near the lower surface of the downward sloping channel. The RSI in the four-hour chart continues to lack direction in the bearish area, while the red Tenkan-sen keeps flattening below the blue Kijun-sen line, reducing chances for a meaningful recovery in the short-term horizon. However, should the price close comfortably above the 20- and 40-period simple moving averages (SMAs) traders [..]

Technical Analysis – WTI futures’ progress above key resistance hits a snag

Posted on November 26, 2020 at 9:30 am GMT

WTI oil futures’ thrust over the governing 43.76 mark seems to be fading from its recently logged eight-and-a-half-month high of 46.22. Although positive signals remain present, the bullish sentiment looks to be stumbling before reaching the 46.80 resistance level. The currently paused Ichimoku lines are still conveying a positive tone, while the 50- and 100-day simple moving averages (SMAs) are communicating a neutral-to-bullish outcome. The short-term oscillators reflect deteriorating positive drive and suggest a retracement may unfold. That said, the [..]

post-image

Technical Analysis – EURUSD retreats after hitting 3-month high

Posted on November 26, 2020 at 9:10 am GMT

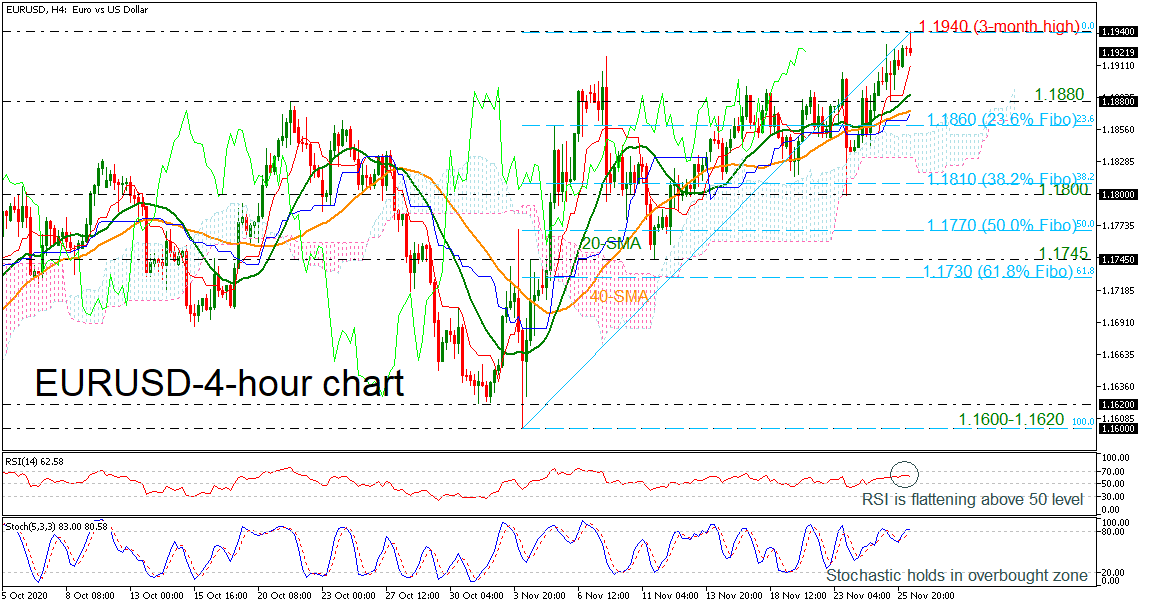
EURUSD has been in an upside tendency since November 4, recording a fresh three-month peak of 1.1940 earlier today. According to the technical indicators, the RSI is holding near the 70 level but is flattening, while the stochastic posted a bearish crossover within its %K and %D lines in the overbought territory. Should the pair strengthen its positive momentum, the next resistance could come around the 1.2010 barrier, registered on September 1. More advances could take the pair until the inside [..]

Technical Analysis – AUDUSD tries to test 2-year high; remains in trading range

Posted on November 26, 2020 at 7:52 am GMT

AUDUSD is surpassing the 0.7340 barrier in the consolidation area of 0.7000-0.7413. The upside tendency this month started after the bounce off the 0.7000 psychological mark and more increases could come if there is a break of the upper bound of the channel. The momentum indicators seem to in a horizontal mode. The RSI is flattening near the overbought territory, while the MACD is trying to extend its bullish structure above its trigger line. However, the 20- and 40-day simple [..]

post-image

Technical Analysis – EURGBP maintains gradual decline; price capped by 50-MA

Posted on November 25, 2020 at 3:57 pm GMT

EURGBP’s recent improvements were curbed by the falling 50-period simple moving average (SMA), redirecting the price southwards. The pair looks to apply significant pressure once more on the 0.8860-0.8873 critical support base. All SMAs are downward-sloping and maintain a predominantly bearish heading, promoting further declines in the pair. The short-term oscillators suggest positive directional momentum is fading. The MACD, in the negative region, is rising above its red trigger line but is finding it difficult to stretch above zero. The [..]

post-image

Technical Analysis – Gold bounces off 1,800; broader outlook is bearish

Posted on November 25, 2020 at 2:37 pm GMT

Gold prices rebounded off the 1,800 significant round number, which is a new four-month low, achieved on Wednesday. The yellow metal is currently approaching the red Tenkan-sen line around 1,818 and the momentum indicators are turning higher. The RSI is testing the 30 level, suggesting that an upward retracement is on cards, while the stochastic posted a bullish crossover in the oversold territory. In case the pair changes its short-term direction to the upside, the bulls will probably challenge the 1,818 immediate [..]

Technical Analysis – NZDUSD’s ascent pauses but confidence remains intact

Posted on November 25, 2020 at 9:06 am GMT

NZDUSD is sustaining its bullish demeanour despite sentiment slowing to a degree, after reaching a 29-month high of 0.7004. The Ichimoku lines are preserving the pair’s positive bearing, while the rising simple moving averages (SMAs) are defending the bullish structure. The short-term oscillators reflect some waning in positive momentum. The MACD, some distance north of the zero line, is flattening above its rising red trigger line, while the RSI, merely above the 70 mark, is pointing southwards. Moreover, the stochastic [..]

Technical Analysis – USDJPY hovers within SMAs; still stands in descending channel

Posted on November 25, 2020 at 7:04 am GMT

USDJPY is pointing slightly upwards, touching the 20- and 40-day simple moving averages (SMAs), remaining in a descending channel since March 3. According to the technical indicators, the MACD is approaching the zero line, holding above its trigger line, while the RSI is touching the neutral threshold of 50 in the near term. A successful increase beyond the 40-day SMA could find immediate resistance at the upper surface of the downward sloping channel at 105.35. If the bulls manage to [..]

post-image

Technical Analysis – EURCHF blocked as upside attempt breeds no result

Posted on November 24, 2020 at 3:49 pm GMT

EURCHF is struggling once again at the overwhelmingly toughened buffer zone of 1.0824-1.0847, containing numerous peaks since late July. The price today spiked touching the 1.0847 level, which happens to be the 61.8% Fibonacci retracement of the down wave from 1.1058 until 1.0504, before returning to its pre-consolidating demeanour. Nonetheless, the small upturn in the slopes of the simple moving averages (SMAs) may assist the price to nudge higher again. The short-term oscillators are reflecting a pause in directional momentum [..]

post-image

Technical Analysis – WTI futures reach 3-month high; positive risks not faded yet

Posted on November 24, 2020 at 1:45 pm GMT

WTI crude oil futures have been in a strong upside tendency since November 2, reaching a fresh three-month peak of 43.7 in the short-term timeframe. From a technical viewpoint, the price is still hovering beyond the 20- and 40-period simple moving averages (SMAs) and the Ichimoku cloud. The RSI indicator is edging north, approaching the overbought territory, while the MACD is extending its bullish structure above its trigger and zero lines. In the positive scenario where the price continues to [..]

Risk Warning: Your capital is at risk. Leveraged products may not be suitable for everyone. Please consider our Risk Disclosure.