XM does not provide services to residents of the United States of America.

Technical Analysis

post-image

Technical Analysis – USDJPY rallies above 104.00; neutral-to-bearish in near-term

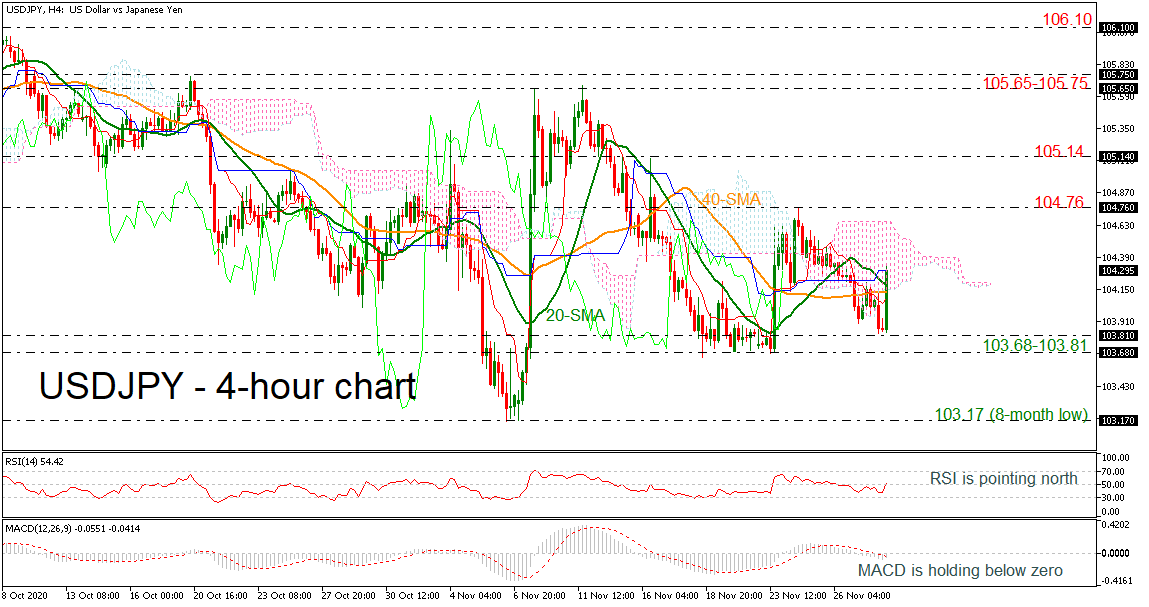
Posted on November 30, 2020 at 9:38 am GMT

USDJPY surged above the 20- and 40-period simple moving averages (SMAs), flirting with the Ichimoku cloud and surpassing the 104.00 psychological level. The RSI is sloping north, resting around the 50 level, though the MACD oscillator is still moving sideways in the negative territory in the 4-hour chart. If buying interest picks up, early tough resistance could occur at the upper surface of the cloud around 104.66. A violation of this level may shoot the pair to challenge 104.76 and [..]

Technical Analysis – EURUSD claims 3-month high; near a critical make or break point

Posted on November 30, 2020 at 8:59 am GMT

EURUSD’s refusal to dive below the 1.1600 floor for the second time has developed into a bullish wave in November, pushing the price comfortably into the 1.1900 area and to an almost three-month high of 1.1975 on Monday. From a technical perspective there is scope for additional improvement in the short run as the price is deviating above the Ichimoku cloud and its 20- and 50-day simple moving averages (SMAs). In other encouraging signals, the MACD continues to gain momentum [..]

Technical Analysis – Gold tumbles to 5-month low; holds in descending channel

Posted on November 30, 2020 at 8:05 am GMT

Gold prices plummeted to a fresh five-month low of 1,764.34 earlier today, reaching the 50.0% Fibonacci retracement level of the up leg from 1,451 to 2,074.89. Currently, the market is still developing within a downward sloping channel since it hit a record high at 2,074.89. According to the RSI, the negative momentum is continuing as it is holding in the oversold zone and is pointing south. However, the stochastic oscillator created a bullish crossover within its %K and %D lines [..]

post-image

Technical Analysis – US 30 index retains bullish bias despite minor pullback   

Posted on November 27, 2020 at 1:37 pm GMT

US 30 stock index (Cash) has retreated ever so slightly from its freshly logged all-time-high of 30,213. Positive sentiment seems to be taking a breather as the index, to some degree, is nudging sideways. The bullish 50- and 100-day simple moving averages (SMAs) could boost the price, sending the index to uncharted peaks. The short-term oscillators are transmitting mixed messages in directional momentum. The MACD, in the positive region, is holding above its red trigger line, while the stochastic oscillator [..]

Technical Analysis – GBPJPY maintains neutral bias as momentum loses steam

Posted on November 27, 2020 at 9:08 am GMT

GBPJPY appears to have been again denied passage above the 140.00 mark, which happens to be the 76.4% Fibonacci retracement of the down leg from 144.94 to 124.00, following a bounce off the 100-day simple moving average (SMA). The sliding 200-day SMA and the horizontal Ichimoku lines aid a pause in positive price action, while the upward incline of the 50- and 100-day SMAs, conveys strength for advances. At this time, the short-term oscillators’ are exhibiting mixed signals in directional [..]

post-image

Technical Analysis – NZDUSD flies to 29-month high above 0.7000

Posted on November 27, 2020 at 8:55 am GMT

NZDUSD has been developing near to multi-month highs of 0.7028, continuing the powerful buying interest that started from 0.6586. The RSI indicator is hovering around the overbought region, while the MACD is strengthening its movement in the bullish area but marginally beneath the trigger line. The simple moving averages (SMAs) are endorsing the upside tendency as all of them are ticking higher in the near term. A jump above today’s high could open the way for the 0.7060 resistance, that being the [..]

Technical Analysis – USDCAD stands around often tested 1.2993; bearish bias

Posted on November 27, 2020 at 8:00 am GMT

USDCAD has found significant support at the 1.2993 barrier over the last three months, posting a negative spike around 1.2930, which is a new two-year low on November 9. The RSI indicator is still moving sideways in the negative territory, while the stochastic oscillator is turning higher, ready to complete a bullish crossover within its %K and %D lines in the oversold zone. The price has been remaining in a descending tendency since April 21 and the next support would come [..]

post-image

Technical Analysis – EURJPY’s mid-Bollinger band defends positive sentiment

Posted on November 26, 2020 at 4:11 pm GMT

EURJPY is finding some footing at the mid-Bollinger band after a pullback from the freshly formed 124.56 high. The 200-period simple moving average (SMA) is endorsing a more neutral picture while the slight positive incline in the 50- and 100-period SMAs is sponsoring further advances. Nevertheless, the short-term oscillators are currently conveying mixed signals in directional momentum. The MACD, some ways in the positive region, is decreasing below its red trigger line, while the stochastic oscillator maintains a negative bearing. [..]

post-image

Technical Analysis – Dollar index springs to life around critical floor

Posted on November 26, 2020 at 2:54 pm GMT

The US Dollar index (December) is nearing the capping mid-Bollinger band at 92.15, after improving slightly from the support section of 91.72-91.80. Despite this recent price development, the bearish bias remains intact, something also being endorsed by the downward sloping simple moving averages (SMAs).     The short-term oscillators reflect the fresh increase in positive momentum. The MACD, in the negative region, has nudged above its red trigger line, while the RSI is rising towards its 50 threshold. The stochastic oscillator [..]

post-image

Technical Analysis – USDCHF stands in descending channel in near term

Posted on November 26, 2020 at 2:20 pm GMT

Technical Analysis – USDCHF stands in descending channel in near term USDCHF registered losses for the second week in a row, dropping to a more than two-week low of 0.9063 today and near the lower surface of the downward sloping channel. The RSI in the four-hour chart continues to lack direction in the bearish area, while the red Tenkan-sen keeps flattening below the blue Kijun-sen line, reducing chances for a meaningful recovery in the short-term horizon. However, should the price close comfortably above the 20- and 40-period simple moving averages (SMAs) traders [..]

Risk Warning: Your capital is at risk. Leveraged products may not be suitable for everyone. Please consider our Risk Disclosure.