XM does not provide services to residents of the United States of America.

Technical Analysis

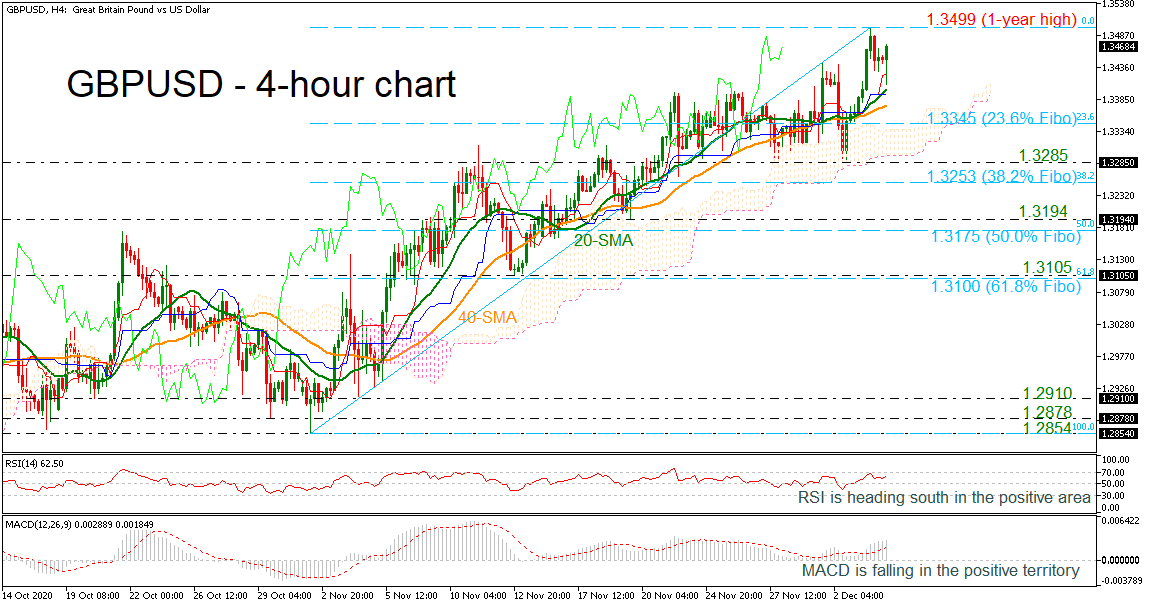
Technical Analysis – GBPUSD takes a hit and fades from fresh 30½-month high  

Posted on December 8, 2020 at 9:11 am GMT

GBPUSD hit a snag and is retreating from its freshly logged multi-month high of 1.3538, and is even back under the previous highs of 1.3514 and 1.3481. The falling red Tenkan-sen line is showing weakness in the positive drive, while the rising blue Kijun-sen line is backing an improving picture. Furthermore, the slight incline in the 200-day simple moving average (SMA), and the rising 50- and 100-day SMAs are protecting the positive structure. Nonetheless, the short-term oscillators are leaning towards [..]

post-image

Technical Analysis – USDJPY although consolidates, still favours downside

Posted on December 7, 2020 at 2:42 pm GMT

USDJPY is plunging below the 104.19 level, which is the current vicinity of the mid-Bollinger band, the 50- and 100-period simple moving averages (SMAs). The pair is weakening within a mini-sideways market with a lower bound of 103.65-103.73 and a higher bound of 104.75. All SMAs still possess their bearish tone, which is assisting the downwards trajectory. The short-term oscillators are suggesting that downside momentum is growing. The MACD, in the negative region, looks set to dip back below its [..]

post-image

Technical Analysis – US 500 index tests another all-time high

Posted on December 7, 2020 at 10:15 am GMT

The US 500 index (cash) is retreating from the record high of 3,705.39, reached earlier today. The technical indicators are currently suggesting a possible retracement in the short-term. The RSI pulled back from the overbought territory, while the %K line of the stochastic oscillator posted a bearish crossover with the %D line above the 80 level. If the price falls further, it could touch the 3,589 barrier before heading south towards the 50- and 100-day simple moving averages (SMAs) currently at 3,500 [..]

Technical Analysis – EURUSD takes a hit; upside risks remain alive

Posted on December 7, 2020 at 9:27 am GMT

EURUSD appears to be fading somewhat from its recently logged 31-month high of 1.2177. That said the rising simple moving averages (SMAs) are defending the dictating bullish structure, keeping additional advances on the table. The short-term oscillators reveal the pause in bullish momentum. The MACD, deep in the positive region, is marginally easing above its red trigger line, while the RSI, although dipping under the 70 mark, is persisting above the supportive trend line. Yet, the stochastic oscillator’s %K line [..]

Technical Analysis – Gold’s gains appear to be an upward correction in a bear market

Posted on December 7, 2020 at 8:56 am GMT

Gold managed to close in the green for the first time after three weeks following the creation of a bullish hammer near a four-month low of 1,764 and the bounce back above its 200-day simple moving average (SMA). The recent row of bullish candles, however, appears to be an upside correction in the downward pattern that started from the record high of 2,079, while the bearish cross within the 20- and 50-day SMAs and the narrowing distance between the 20- and 200-day SMAs remain [..]

post-image

Technical Analysis – AUDUSD falls near 0.7400 in upward sloping channel

Posted on December 7, 2020 at 8:46 am GMT

AUDUSD is falling near the 20-period simple moving average (SMA) after the bounce off the 28-month high of 0.7450, reached on December 3. The price has been trading within an upward sloping channel over the last month. The RSI indicator is heading south in the positive territory, while the MACD is dropping beneath its trigger line in the bullish zone. Also, the pair is capped by the red Tenkan-sen line suggesting some losses in the very short-term. Immediate support could [..]

post-image

Technical Analysis – US 30 index conveys confidence above MAs  

Posted on December 4, 2020 at 1:27 pm GMT

The US 30 stock index (Cash) is tiptoeing higher after finding traction off the 100-period simple moving average (SMA), attached to the lower surface of the Ichimoku cloud. Although the Ichimoku lines are fairly directionless, the red Tenkan-sen line is nudging the price marginally higher. The indices’ positive structure appears safeguarded above the support zone of 28,838-28,957 and is being defended by the improving trajectory of the SMAs. The short-term oscillators are echoing intact positive momentum. The MACD, slightly above [..]

post-image

Technical Analysis – Tesla’s bullish momentum shows signs of exhaustion

Posted on December 4, 2020 at 12:32 pm GMT

Tesla’s stock is seeking to re-challenge its record high of 602.44 having bounced from near the 20-period exponential (EMA) moving average in the four-hour chart. The RSI and the MACD, however, are questioning the positive appetite in the price as the former, although in the bullish area, seems to be printing a series of lower highs, while the latter is showing no strength below its red signal line. The above suggest some slowdown in the market, which could develop towards the 23.6% Fibonacci retracement of the [..]

post-image

Technical Analysis – GBPUSD eases below 1-year high around 1.3500

Posted on December 4, 2020 at 10:14 am GMT

GBPUSD is losing ground after it reached a fresh one-year high marginally below 1.3500 on Thursday. The momentum indicators suggest there is still some downside move before the pair advances again. The RSI is heading south in the positive area, while the MACD is losing momentum in the bullish territory. Should the price make another run higher, it’s likely to meet resistance at 1.3499. A successful break above this key resistance could open the way for the May 2018 high at 1.3600 before [..]

post-image

Technical Analysis – NZDUSD pulls under Ichimoku lines; bullish structure unbroken     

Posted on December 4, 2020 at 10:13 am GMT

NZDUSD is receding below the flattening blue Kijun-sen line around 0.7054 in the four-hour chart, after a bullish trend off 0.6612 thrusted the pair up towards a 31-month high of 0.7103. The Ichimoku lines are indicating some stalling in positive price action, while the soaring simple moving averages (SMAs) are safeguarding the positive structure. Nevertheless, the short-term oscillators are echoing clues that a deeper negative retracement could unfold before the climb resumes. The MACD, after hovering for some time beneath [..]

Risk Warning: Your capital is at risk. Leveraged products may not be suitable for everyone. Please consider our Risk Disclosure.