XM does not provide services to residents of the United States of America.

Technical Analysis

post-image

Technical Analysis – EURCHF remains optimistic although advances hit a snag

Posted on December 28, 2020 at 4:03 pm GMT

EURCHF is retreating from a fresh 6½-month peak of 1.0891, although continuing to retain a somewhat bullish tone. The pair appears to have logged a false break above the 1.0870-1.0876 resistance ceiling, soaring to a new high marginally above the 1.0889 barrier from June 8. The flattening 100-period simple moving average (SMA) is sponsoring the neutral-to-bullish demeanour in the price, while the rising 50- and 200-period SMAs are backing further positive price action. However, the short-term oscillators are currently reflecting [..]

post-image

Technical Analysis – Silver regains bullish desire with bounce off 100-day SMA

Posted on December 28, 2020 at 1:32 pm GMT

Silver gapped higher, spiking above the 26.56 resistance today, continuing the recent traction the commodity found off the 100-day simple moving average (SMA). The climbing 200-day SMA is defending the positive structure, while the flattening 100-day SMA, is endorsing waning in the commodity’s improvement. Nonetheless, the slight upturn in the 50-day SMA together with the pickup in positive sentiment in the short-term oscillators are promoting additional advances. The MACD, in the positive region, is holding above its red trigger line, [..]

post-image

Technical Analysis – US 500 index unlocks fresh all-time highs before the end of the year

Posted on December 28, 2020 at 12:54 pm GMT

The US 500 stock index (cash) is exploring new all-time highs marginally above last week’s top of 3,730 following the approval of the US stimulus package, which averted a government shutdown and secured funding through September. The bullish move is well supported by the 20-day simple moving average (SMA) once again, though the muted reaction in the MACD, which continues to fluctuate below its red signal line, the flattening red Tenkan-sen, and the sideways trajectory in the RSI suggest that the positive [..]

post-image

Technical Analysis – AUDUSD recoups lost ground; resumption of uptrend in focus

Posted on December 28, 2020 at 10:27 am GMT

AUDUSD has almost recouped the downfall from the 2 ½-year high of 0.7638 despite the narrow trading the past two days in the four-hour chart. Although some weakness could be possible in the near term given the touch around the upper Bollinger band, market sentiment remains largely positive as the RSI holds comfortably above its 50 neutral mark despite the latest pullback, and the MACD continues to strengthen within the bullish territory and above its red signal line. The Ichimoku [..]

post-image

Technical Analysis – Gold clashes with hardened upside boundary

Posted on December 28, 2020 at 9:12 am GMT

Gold is in the process of confronting a fortified resistance zone from 1,896-1,907. This reinforced region comprises of highs, the 100-day simple moving average (SMA), the Ichimoku cloud and the overlapping descending trend line pulled from the all-time high. The horizontal blue Kijun-sen line and the mild downward slopes of the 50- and 100-day SMAs are promoting a more neutral-to-bearish picture. However, the bullish tone in the rising red Tenkan-sen line and the hiking 200-day SMA, as well as the [..]

post-image

Technical Analysis – GBPUSD resilient within bullish channel after Brexit trade deal

Posted on December 28, 2020 at 8:36 am GMT

GBPUSD held within the 1.3500 territory on Monday and slightly below its 2 ½-year high of 1.3623 following the endorsement of a skinny Brexit trade deal and the approval of the US stimulus package. From a technical perspective, the short-term bias remains tilted to the upside despite the rejection around the topline of the upward-sloping channel as the price continues to trade above its simple moving averages (SMAs) and the Ichimoku cloud. The momentum indicators are also in favor of [..]

post-image

Technical Analysis – GBPJPY crosses 140.30 border but will the bulls persist?

Posted on December 24, 2020 at 12:02 pm GMT

GBPJPY is pushing efforts to close above the noisy 140.30 ceiling that kept the bulls under control the past six weeks. The RSI and the MACD are endorsing the buying appetite in the market, though some caution is warranted as the former is approaching a restrictive trendline and the latter has yet to show a clear positive direction above its red signal line. Should the bulls persist, the pair could retest the 141.85 resistance region before meeting the crucial trendline from March’s lows around September’s [..]

post-image

Technical Analysis – GBPUSD favours upside; vicious appreciation boosts bias

Posted on December 24, 2020 at 11:35 am GMT

GBPUSD recently logged nine consecutive green candles and is quickly approaching the 31½-month high of 1.3624. The price found some footing just beneath the 200-period simple moving average (SMA) and then skyrocketed from there, restoring the bullish tone within the pair. The rising Ichimoku lines and the 50-period SMA are endorsing further gains, while the gradual upwards incline in the 100- and 200-period SMAs is preserving positive sentiment. Likewise, the short-term oscillators are skewed to the upside. The MACD, in [..]

post-image

Technical Analysis – EURUSD constrained within a triangle pattern

Posted on December 24, 2020 at 9:11 am GMT

EURUSD has been slowly regaining ground along the upper surface of the Ichimoku cloud and the base of a small symmetrical triangle in the four-hour chart, but a decisive close above the 1.2200 has been somewhat burdensome recently. The momentum indicators suggest depressed bullish pressures in the short run as the RSI and the MACD continue to hover near their neutral levels and the red Tenkan-sen line remains attached to the blue Kijun-sen. The topline of the triangle seen around [..]

post-image

Technical Analysis – USDCAD declines further below descending trend line

Posted on December 24, 2020 at 9:03 am GMT

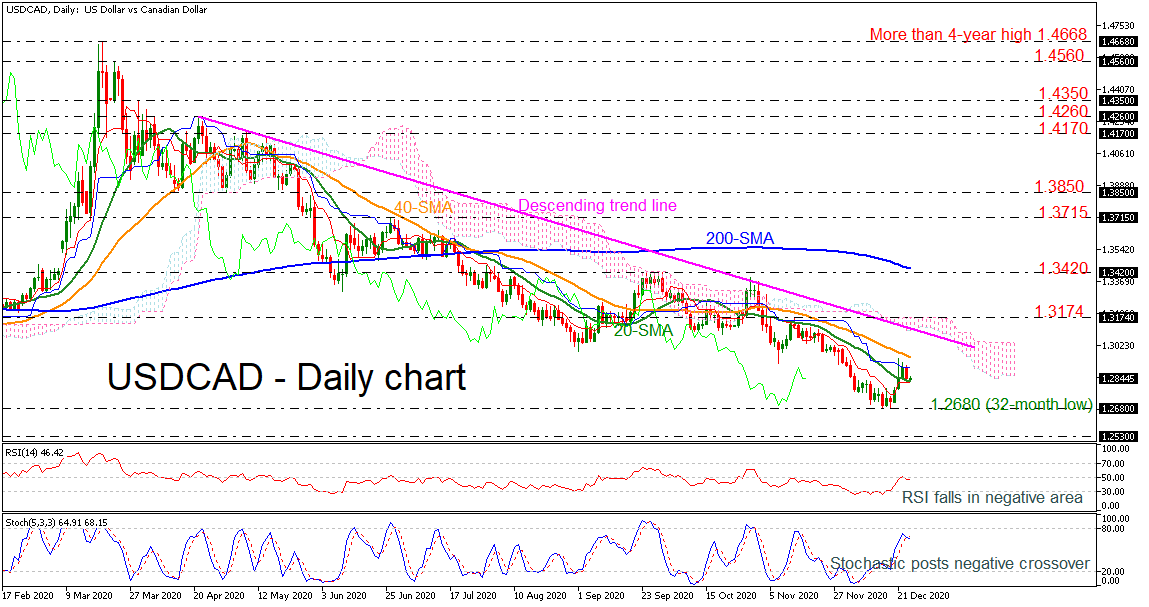
USDCAD has been consolidating losses since the day it plunged from the more than four-year high of 1.4668. Currently, in the very-short-term, the price is hovering above the 32-month low of 1.2680 and is flirting with the 20-day simple moving average (SMA). The momentum indicators are suggesting that the sell-off may continue. The RSI is pointing down in the negative territory, while the stochastic posted a bearish crossover within its %K and %D lines. Additionally, in the Ichimoku indicator, the red Tenkan-sen line is flattening below the blue Kijun-sen [..]

Risk Warning: Your capital is at risk. Leveraged products may not be suitable for everyone. Please consider our Risk Disclosure.