XM does not provide services to residents of the United States of America.

Technical Analysis

post-image

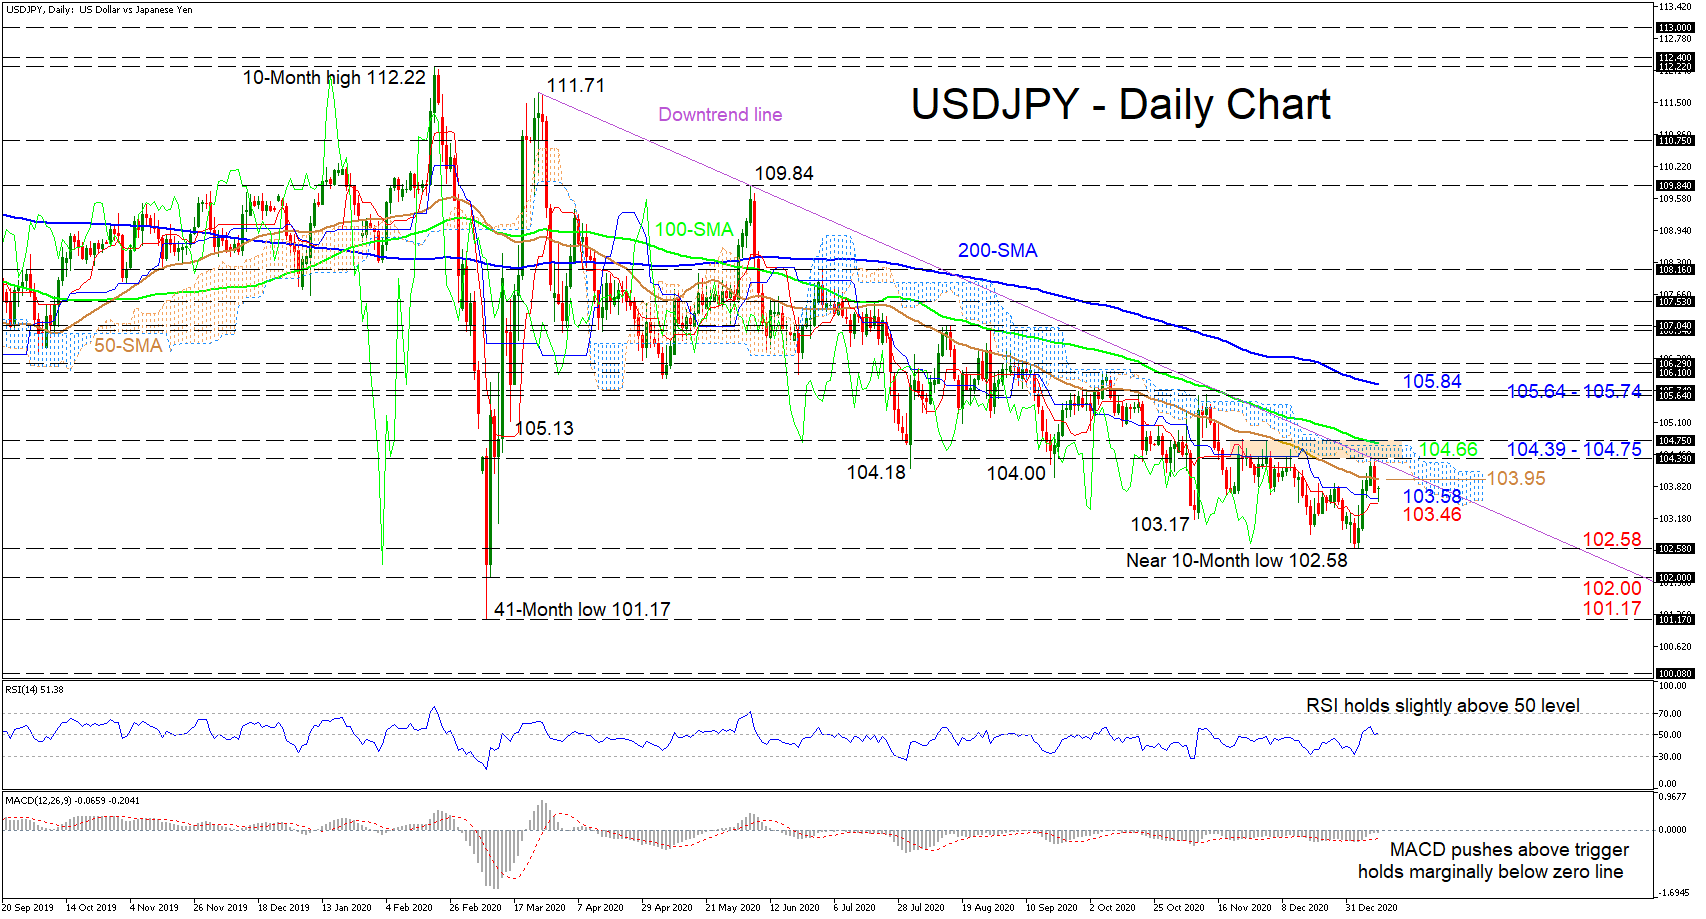
Technical Analysis – USDJPY advances curbed by cloud and downtrend line

Posted on January 13, 2021 at 8:57 am GMT

USDJPY seems to be re-adopting its negative tone after being redirected below the 50-day simple moving average (SMA), following the recent deflection off the downtrend line drawn from the 111.71 peak. The flattening Ichimoku lines are suggesting a pause in negative price action, while the controlling SMAs are escorting the pair even lower. The short-term oscillators currently do not give any compelling signals in directional momentum. The MACD, in the negative region, has thrusted above its red trigger line but [..]

Technical Analysis – GBPJPY tests September’s resistance; has some bullish potential

Posted on January 13, 2021 at 8:15 am GMT

GBPJPY is finally testing September’s resistance region of 141.85 after finding enough strength to breach the 140.30 ceiling that kept the bulls in check over the past two months. The positive momentum in the MACD and the rising RSI, which has still some distance to cover before touching a support-turned resistance line, suggest that there is some bullish fuel in store. Yet, to keep this optimism alive, the red Tenkan-sen line at 140.70 and the area around 140.30, where the [..]

post-image

Technical Analysis – Gold struggles below 50.0% Fibonacci; flat in short-term

Posted on January 13, 2021 at 8:03 am GMT

Gold prices found significant resistance around the 50.0% Fibonacci retracement level of the upward wave from 1,764 to 1,959.32 at 1,862, holding marginally above the 20-period simple moving average in the 4-hour chart. According to the technical indicators, the stochastic is looking overbought, as the %K line jumped above the 80 level after a bullish cross with the %D line. Moreover, the RSI is flattening around the 50 level, confirming the recent neutral bias on price. Should the precious metal [..]

post-image

Technical Analysis – EURCHF pulls back off heavy border; progressive picture unbroken  

Posted on January 12, 2021 at 1:05 pm GMT

EURCHF has abated to the mid-Bollinger band around 1.0819 after recent attempts to appreciate, including the false break out of 1.0891, were capped by the upper Bollinger band and the tough resistance ceiling of 1.0857-1.0877. The simple moving averages (SMAs) are promoting an overall neutral-to-bullish demeanour in the pair. The short-term oscillators reflect a situation of strained directional momentum but weakly lean towards retaining a somewhat positive tone. The MACD, slightly above the zero mark, is trailing below its red [..]

post-image

Technical Analysis – USDCAD posts losses in Ichimoku cloud

Posted on January 12, 2021 at 9:43 am GMT

USDCAD posted losses for the second consecutive period, pulling back from the 200-period simple moving average (SMA) around the 1.2835 resistance and is now hovering in the Ichimoku cloud. The RSI in the 4-hour chart is falling further in the positive area, while the MACD is losing some momentum above its trigger and zero lines.  However, the red Tenkan-sen is still moving above the blue Kijun-sen line while the 20- and 40-period SMAs created a bullish crossover in the preceding sessions, which is still acting as support. However, should the price close comfortably below the [..]

Technical Analysis – GBPUSD’s retraction unable to tilt appreciation scale

Posted on January 12, 2021 at 9:05 am GMT

GBPUSD continues to echo a positive tone despite recently retreating from a fresh 32-month high of 1.3703. The rising red Tenkan-sen line is suggesting positive momentum is growing, while the flattening blue Kijun-sen line is indicating that the ascent is under stress. Nonetheless, the advancing simple moving averages (SMAs) are defending the bullish picture. Furthermore, the short-term oscillators are conveying a pickup in positive sentiment. The MACD remains some distance above the zero line despite weakening slightly below its red [..]

Technical Analysis – EURJPY bulls take a breather near 2-year high

Posted on January 12, 2021 at 8:29 am GMT

EURJPY geared down after topping near the familiar 127.50 barrier from 2017 – 2018, but the 20-day simple moving average (SMA) slightly lower at 146.47 managed to put some breaks to selling forces, preventing any move towards the key 146.00 support region. Currently, the short-term bias is looking neutral as the red Tenkan-sen line is flattening marginally above the stable blue Kijun-sen and the RSI seems to be stabilizing its downward move slightly above 50. The bears, however, may not [..]

post-image

Technical Analysis – WTI futures flirt with 11-month peak; indicators look overbought

Posted on January 12, 2021 at 8:05 am GMT

WTI crude oil futures have reversed higher again reaching a fresh eleven-month high of 52.70, however, the MACD oscillator now suggests that the market sentiment might get worse before getting better. The RSI is approaching the overbought territory, indicating a possible pullback in the very short-term timeframe. If the price manages to move higher again and surpass the eleven-month high of 52.75 it could take the market towards the 54.62 resistance, registered in February 2020. Alternatively, the market might revisit the 20-period simple moving average (SMA) [..]

post-image

Technical Analysis – US 500 index looks optimistic despite minor retreat

Posted on January 11, 2021 at 1:58 pm GMT

The US 500 index (Cash) has retracted ever so slightly after stalling around the fresh all-time high of 3,831. Although the Ichimoku lines are revealing the ebbing in positive price action, the bullish demeanour of the simple moving averages (SMAs) is defending the positive structure. The withdrawal in price will have to mature into a deeper retracement to have any significant effect on the upwards drive. The short-term oscillators are transmitting mixed frequencies in directional sentiment. The MACD, in the [..]

post-image

Technical Analysis – AUDUSD bounces off 23.6% Fibo; bullish in medium term

Posted on January 11, 2021 at 9:45 am GMT

AUDUSD has rebounded on the 23.6% Fibonacci retracement level of the upward move from 0.7254 to 0.7820 at 0.7688 after the selling interest from the 22-month high of 0.7820. According to the technical indicators, the RSI is sloping up in the bearish zone, however, the MACD is hitting the zero level below its trigger line. Should the pair manage to strengthen its positive momentum, the next resistance could come around the 40-period simple moving average (SMA) at 0.7735 before resting [..]

Risk Warning: Your capital is at risk. Leveraged products may not be suitable for everyone. Please consider our Risk Disclosure.