XM does not provide services to residents of the United States of America.

Technical Analysis

post-image

Technical Analysis – Gold meets 100-SMA again; neutral bias

Posted on January 20, 2021 at 3:06 pm GMT

Gold prices have been developing within a consolidation area over the last almost two-weeks with upper boundary the 1,863 resistance and the 100-period simple moving average (SMA) and lower boundary the 1,817 support level. However, the technical indicators are not supporting this horizontal trajectory, but they are showing mix signals. The stochastic is standing in the overbought zone but is pointing down and the RSI is heading north in the positive area. A successful climb above the 1,863 crucial level could take the yellow [..]

post-image

Technical Analysis – EURGBP’s picture dampens with dive under key support base

Posted on January 20, 2021 at 12:13 pm GMT

EURGBP plunged today underneath the critical support foundation of 0.8860-0.8884 that had defended the positive structure since the end of May 2020. The falling 50- and 100-period simple moving averages (SMAs) are endorsing further deterioration in the pair, while the 200-period SMA retains a more neutral tone. The short-term oscillators are also demonstrating a minor rise in negative momentum. The MACD, some distance below zero, has slipped back underneath its red trigger line, while the declining RSI has reached the [..]

post-image

Technical Analysis – GBPJPY re-conquers MAs and cloud; favours upside

Posted on January 20, 2021 at 8:35 am GMT

GBPJPY’s upward march appears to have stalled lately between 140.32 and 142.25, although the pair is still emitting a bullish tone as the price hikes the cloud’s upper band after a rebound off the 140.32 barrier. At the moment, the Ichimoku lines are not giving any clear directional signals, while all the advancing simple moving averages (SMAs) are sponsoring a dictating bullish bearing. The short-term oscillators are also suggesting positive momentum is improving. The MACD, not too far above its [..]

post-image

Technical Analysis – NZDUSD bounces off 40-SMA; positive outlook remains intact

Posted on January 20, 2021 at 8:16 am GMT

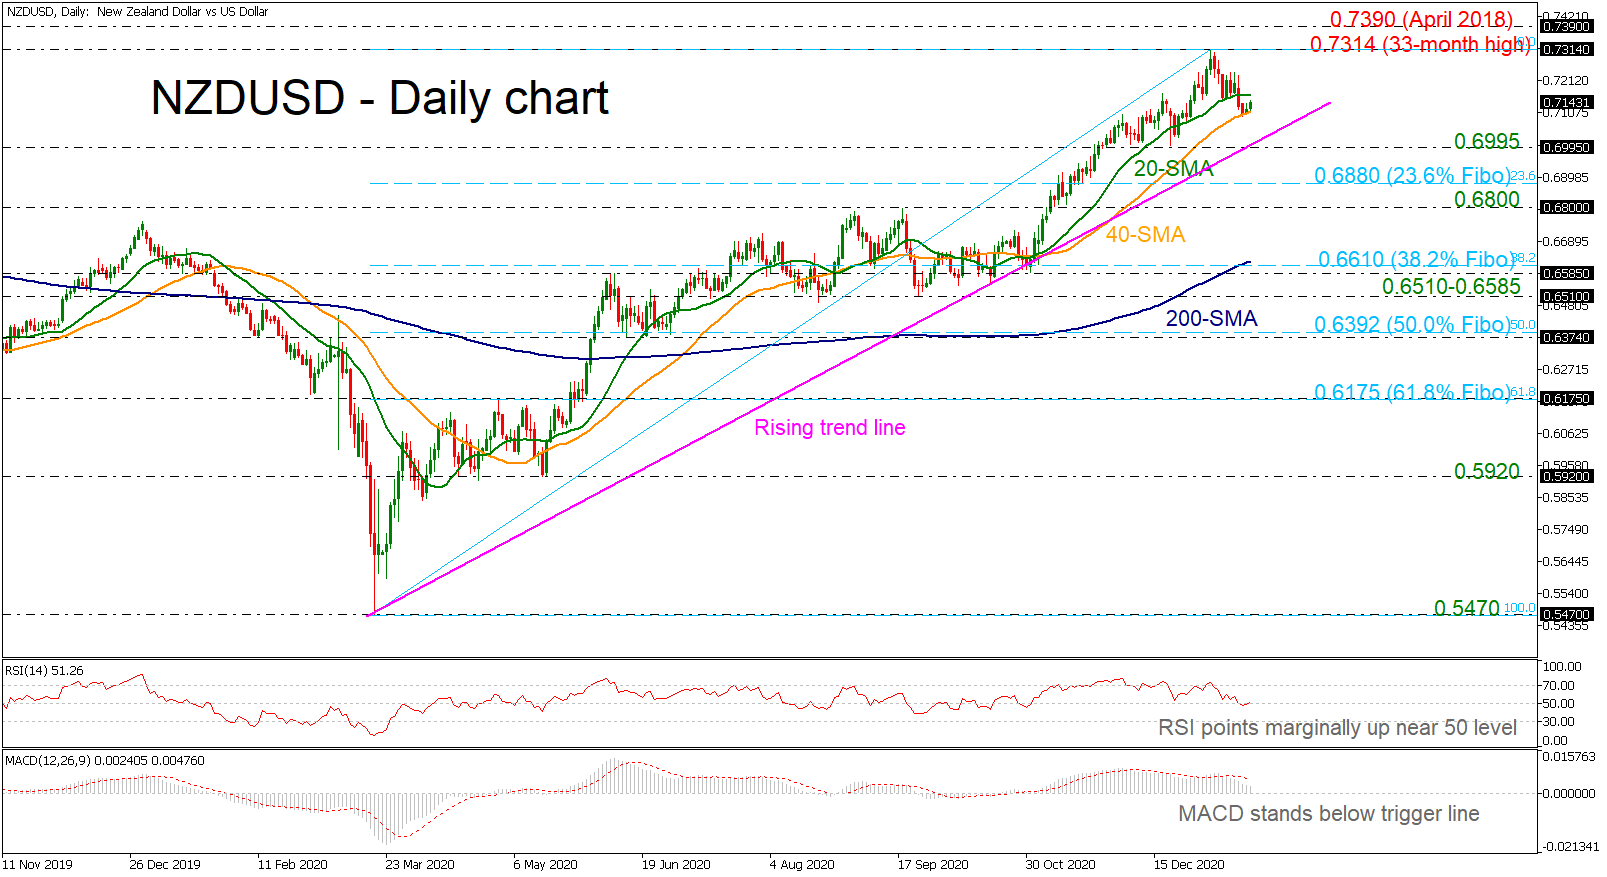
NZDUSD has rebounded off the 40-day simple moving average (SMA) since yesterday, remaining well above the long-term ascending trend line. The RSI is heading upwards with weak momentum, approaching the positive territory, however, the MACD is falling beneath its trigger line, mirroring the latest decline in the price action from the 33-month high of 0.7314.   Immediate resistance to further gains would likely come from the multi-month high of 0.7314. If there is a successful break above this area, further resistance could be met around the 0.7390 barrier, taken from [..]

Technical Analysis – USDJPY gets squeezed below major resistance

Posted on January 20, 2021 at 7:04 am GMT

USDJPY is trapped between its 20- and 50-day simple moving averages (SMAs) and beneath the surface of the crucial 10-month old descending channel as the 104.00 level keeps cancelling bullish actions. The RSI and the MACD remain flat around their neutral levels, whereas the bullish cross between the red Tenkan-sen and Blue Kijun-sen lines is currently providing hope that the next move in the price could be positive. The latter, however, awaits a confirmation above the 104.00 number and the channel’s topline, while [..]

post-image

Technical Analysis – Apple stock declines somewhat in short-term; bullish in long-term

Posted on January 19, 2021 at 2:30 pm GMT

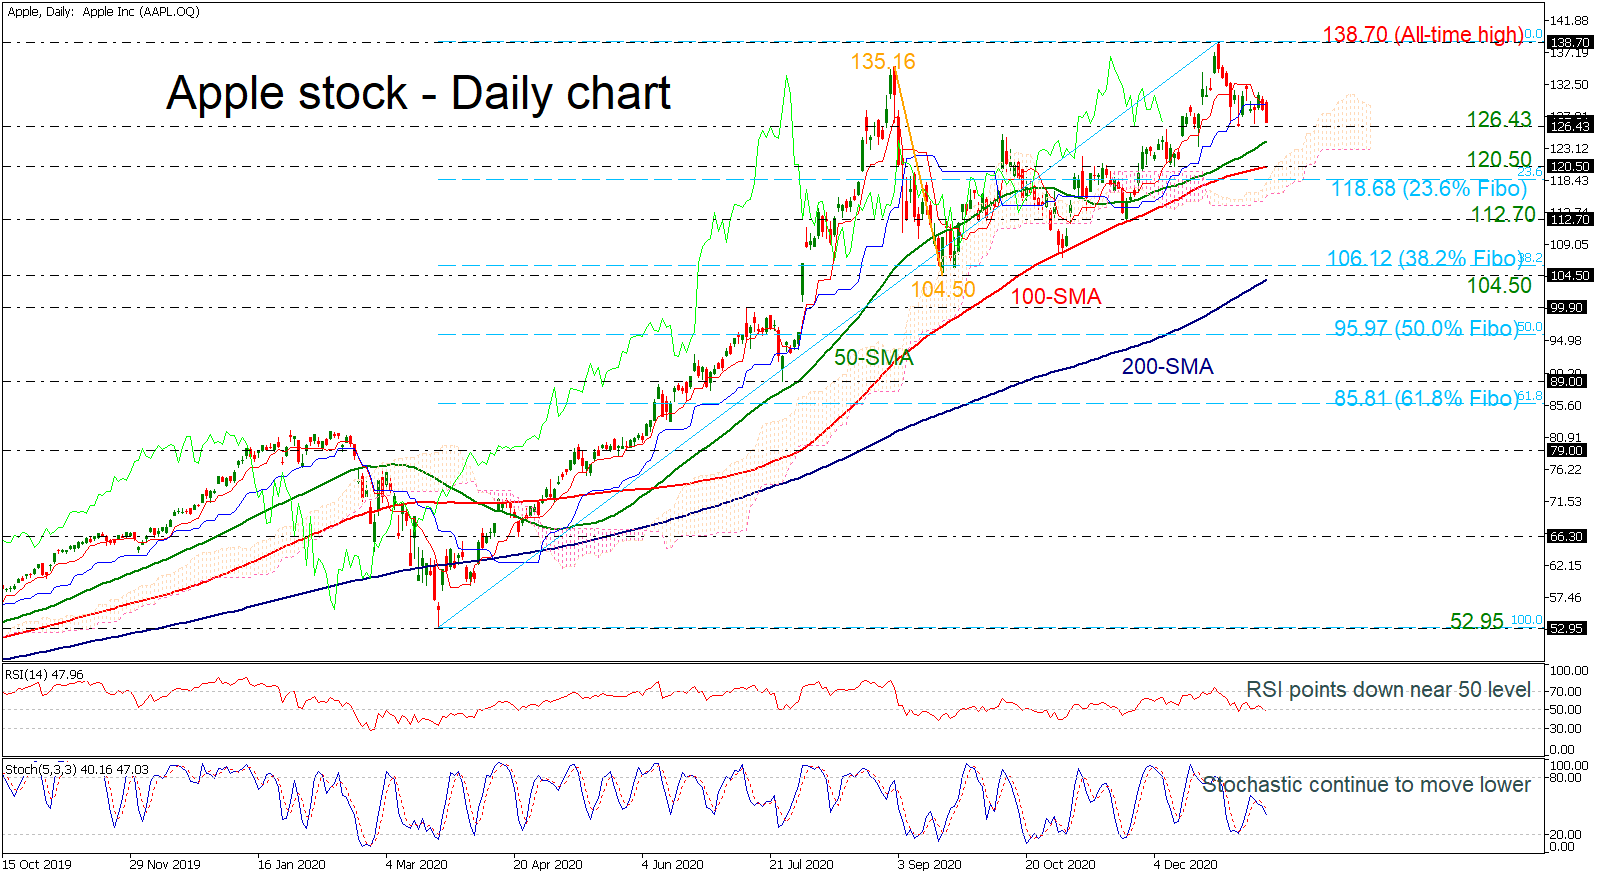
Apple stock price appears to be losing ground, finding powerful support at the 126.43 barrier. A paused state of directional momentum is reflected in the Ichimoku lines, while the price rests above the upper surface of the Ichimoku cloud. The bearish signals in the short-term oscillators further reflect the fall in the price. The RSI has barely inched below the 50 level, while the stochastic indicator is moving south. If sellers drive the index below the 126.43 support, the 50-day simple [..]

post-image

Technical Analysis – USDCAD ranges, with upside efforts curbed by 200-MA

Posted on January 19, 2021 at 12:45 pm GMT

USDCAD appears to have glided into a sideways market with a floor at 1.2624 and a ceiling at 1.2834. The price is currently standing on the slight upturn in the 50-period simple moving average (SMA), trying to gain some footing. Nevertheless, from the beginning of the year, the picture is fairly neutral, something also demonstrated in the directionless Ichimoku lines. The dictating 100- and 200-period SMAs are defending the broader negative picture, while the short-term oscillators and the subsided negative [..]

post-image

Technical Analysis – Netflix stock faces SMA resistance ahead of Q4 earnings report

Posted on January 19, 2021 at 11:11 am GMT

Netflix’s stock has been volatile within the range of 457.45 – 574.68 since mid-June, though in the four-hour chart, the simple moving average lines (SMAs) seem to have been navigating the price to the downside over the past two weeks. The negative slope in the RSI and the trendless negative MACD are currently keeping the odds for a significant upside reversal minimal, suggesting that a drop towards the 61.8% Fibonacci level of the latest upleg at 493.10 could be more likely. If [..]

post-image

Technical Analysis – WTI futures consolidate but continue to favour upside

Posted on January 19, 2021 at 9:10 am GMT

WTI oil futures appear to be finding a foothold on the 50-period simple moving average (SMA) and the cloud’s upper surface, after the pullback from the 11-month high region of 53.91. The Ichimoku lines are reflecting the sideways edging in the price, while the climbing SMAs are promoting additional advances. Looking at the short-term oscillators, we can see a slight pickup in positive momentum. The MACD is holding marginally below its red trigger line and the zero mark, while the [..]

Technical Analysis – GBPUSD bulls retain footing despite pullback

Posted on January 19, 2021 at 8:20 am GMT

GBPUSD managed to calm bearish forces around the 20-day simple moving average (SMA) once again following the latest rejection from the 1.3700 level, hinting that bullish appetite has not fully faded yet. In the near-term, the consolidation phase may continue as the RSI and the MACD keep lacking direction, with the former sidelining above its 50 neutral mark and the latter hovering around its red signal line. The red Tenkan-sen also remains trendless above the blue Kijun-sen line, suggesting an [..]

Risk Warning: Your capital is at risk. Leveraged products may not be suitable for everyone. Please consider our Risk Disclosure.