XM does not provide services to residents of the United States of America.

Technical Analysis

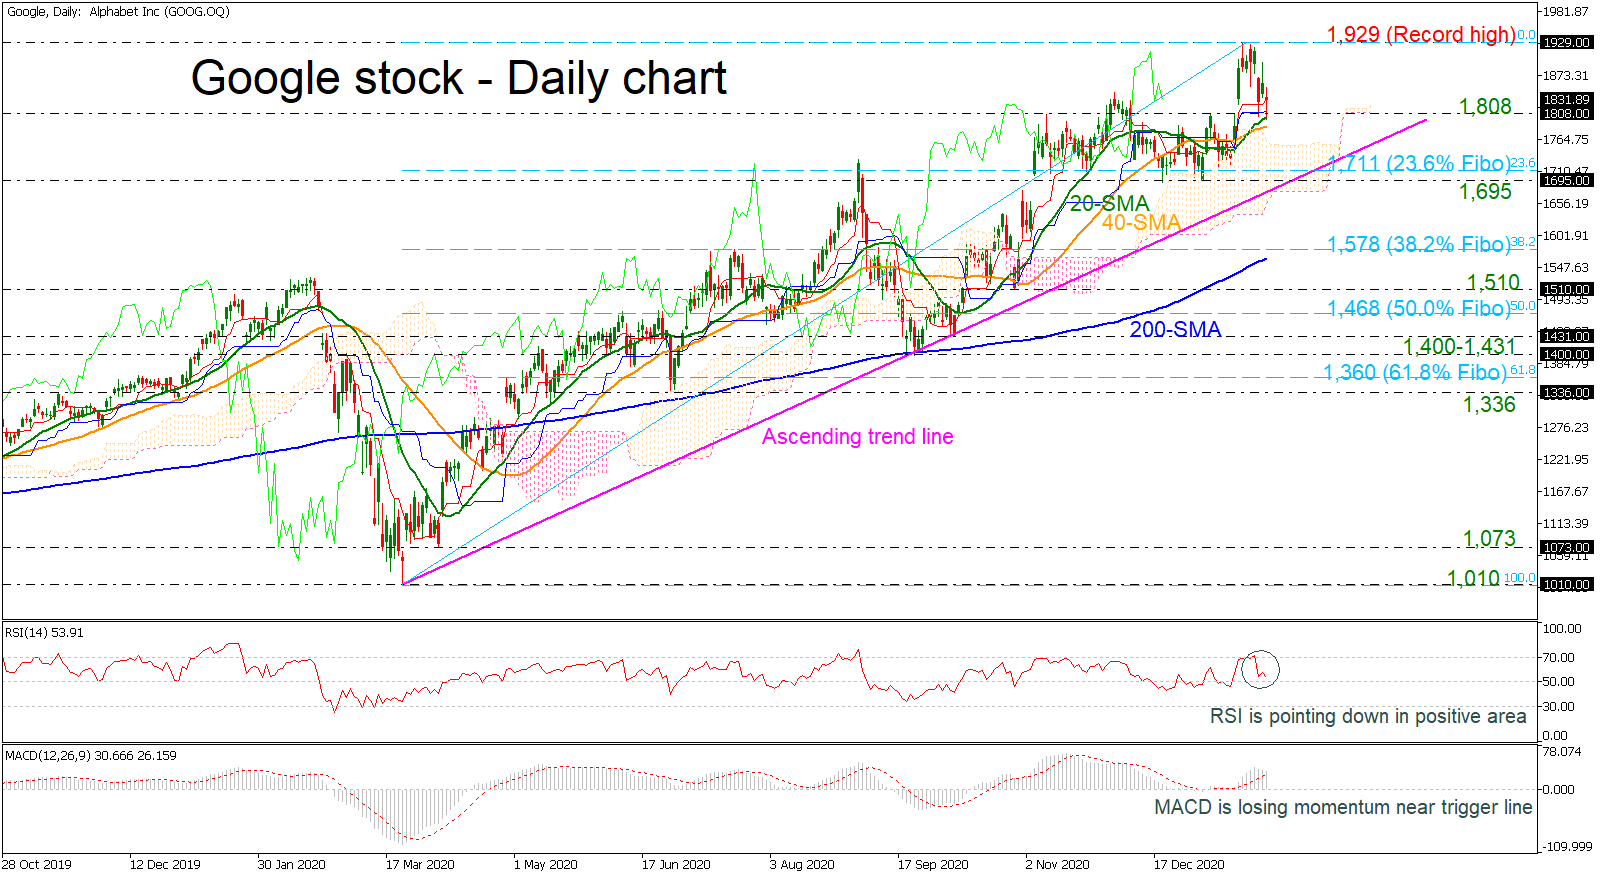
Technical Analysis – EURUSD’s pullback consolidates into Ichimoku cloud

Posted on February 1, 2021 at 9:22 am GMT

EURUSD is currently edging sideways around the 50-day simple moving average (SMA) and crawling into the Ichimoku cloud, after a retracement from the recent 32½-month high of 1.2349. Despite the retraction, the slowed negative bearing in the red Tenkan-sen line and the flattening of the blue Kijun-sen line are both backing the stalling price action. Nonetheless, the climbing SMAs are retaining a bullish tone, which is nurturing the positive structure. Evaporating directional momentum is apparent in the short-term oscillators. Lately, [..]

Technical Analysis – Gold gets congested near tough resistance after positive gap

Posted on February 1, 2021 at 8:35 am GMT

Gold opened Monday’s session with a small positive gap, which settled the price slightly above its constraining simple moving averages (SMAs) and near the tough topline of the descending channel at 1,864. A decisive close above that resistance trendline is required to keep the bulls in play. However, the 38.2% Fibonacci retracement of the August downfall at 1,883 and the surface of the Ichimoku cloud are placed in the same location, increasing the difficulty of such a violation. The RSI [..]

post-image

Technical Analysis – Google stock pauses below record high; bias titled to the upside

Posted on February 1, 2021 at 8:12 am GMT

Google stock has been in a downside correction after the upward rally towards the all-time high of 1,929, touching the 20-day simple moving average (SMA). From a technical perspective, the short-term bias is viewed as negative, reflected by the descending move in the technical indicators. The RSI is pointing down in the positive territory, while the MACD is losing momentum near its trigger line and above the zero level. However, the 20- and 40-day SMA posted a bullish crossover and [..]

post-image

Technical Analysis – GBPUSD’s improving picture seems unstoppable

Posted on January 29, 2021 at 1:59 pm GMT

GBPUSD is aggressively returning higher to the vicinity of the near 33-month high of 1.3758, after a pullback was rescued around the cloud’s upper band. A persevering upwards drive above the tentative trend line, pulled from the 1.2854 level in November 2020, is being reflected in the pair even though the recent pace in its climb has slowed somewhat. The unwavering simple moving averages (SMAs) are promoting the bullish picture, while the short-term oscillators are also endorsing the pair’s positive [..]

post-image

Technical Analysis – NZDUSD retests 200-period SMA; bearish bias

Posted on January 29, 2021 at 10:17 am GMT

NZDUSD is outperforming over the last three weeks in a descending channel, holding near the 200-period simple moving average (SMA) and beneath the Ichimoku cloud. The RSI is sloping marginally up in the bearish region, while the MACD is trying to surpass the trigger line below the zero level. The 20- and 40-period SMAs created a bearish crossover, pointing to more downside movement. If the bulls dominate above the 200-period SMA, the spotlight will shift back to the 0.7195 resistance, [..]

Technical Analysis – GBPJPY’s confidence grows with every inch higher

Posted on January 29, 2021 at 8:54 am GMT

GBPJPY has leaped above the crucial barrier of 142.70 after posting gains for more than a month. The positive price action to an eleven-month high, just beneath the 143.71 barrier, is still being nourished by the bullish Ichimoku lines, while the simple moving averages (SMAs) are preserving the progressing picture. The short-term oscillators are also adding credence to the upside. The MACD, in the positive region, is tiptoeing above its flattening red trigger line, while the rising RSI is approaching [..]

Technical Analysis – USDCAD ticks higher near falling trend line

Posted on January 29, 2021 at 8:08 am GMT

USDCAD is gaining some ground for the third consecutive day above the 20- and 40-day simple moving averages (SMAs), rebounding off the 33-month trough of 1.2585. The pair is flirting with the long-term falling trend line around the 1.2900 psychological level. According to the technical indicators, the stochastic is suggesting an overbought market as the %K line advanced above the 80 level, while the RSI is pointing upwards above the 50 level with stronger momentum than begore. The short-term moving [..]

post-image

Technical Analysis – US 30 index’s pullback contested by 38.2% Fibonacci

Posted on January 28, 2021 at 3:23 pm GMT

The US 30 stock index (Cash) has found footing on the 30,047 level, which happens to be the 23.6% Fibonacci retracement of the up leg from 26,065 until 31,284, after receding from its latest all-time high of 31,284. Yesterday’s losses saw the index pierce below the 50-day simple moving average (SMA), last encountered in early November of last year, to only recoup most of them today with a bounce off the 23.6% Fibo. The rising SMAs are protecting the positive [..]

post-image

Technical Analysis – EURUSD downside risks remain below trend line and 200-MA

Posted on January 28, 2021 at 12:50 pm GMT

EURUSD is consolidating between the curbing 200-period simple moving average (SMA) and the key support zone of 1.2052-1.2080 after the correction from the 32½-month high of 1.2349. The stabilising 50- and 200-period SMAs are promoting the horizontal picture, while the falling 100-period SMA and its recent bearish crossover of the 200-period SMA is nurturing a weakening outlook. The short-term oscillators are gesturing mixed signals in directional momentum. The MACD is stalling below its zero and trigger lines, while the RSI [..]

post-image

Technical Analysis – EURAUD rallies above 200-SMA after double bottom emerges

Posted on January 28, 2021 at 10:16 am GMT

EURAUD completed a bullish double bottom formation in the four-hour chart and spiked to a three-week high of 1.5946 on Thursday after closing comfortably above the 1.5770 neckline. The area around the 200-period simple moving average (SMA), which has seen many struggles in December, is currently in target. A descending trendline stretched from 1.6409 and the 38.2% Fibonacci retracement of the downfall from 1.6418 to 1.5592 are in the same neighborhood, making the region more challenging as the RSI and the Stochastics are still strengthening within [..]

Risk Warning: Your capital is at risk. Leveraged products may not be suitable for everyone. Please consider our Risk Disclosure.