XM does not provide services to residents of the United States of America.

Technical Analysis

Technical Analysis – EURJPY still consolidating; unable to break above upper channel

Posted on February 9, 2021 at 7:03 am GMT

EURJPY has been consolidating since December and has been stuck within the 23-month high of 127.50 and the 125.15 support. The neutral-to-bullish picture in the medium-term looks to last for a while longer after prices failed to break above the upper channel and the RSI is losing momentum in the positive territory. The MACD oscillator is moving horizontally near the trigger and zero lines. If prices head higher, resistance should come from 127.50 before taking the pair back to bullish [..]

post-image

Technical Analysis – US 500 index favours upside despite minor dwindling

Posted on February 8, 2021 at 1:03 pm GMT

The US 500 index (Cash) seems to be faintly stalling above the red Tenkan-sen line around 3,890, after touching a fresh all-time-high of 3,907. Nevertheless, the Ichimoku lines are retaining a bullish tone despite the marginal pausing in the blue Kijun-sen line, while the upwards creeping simple moving averages (SMAs) are nourishing improvements in the price. Yet, for negative pressures to gain strength, the index would need to retract below the 3,814 level, which happens to be the 38.2% Fibonacci [..]

post-image

Technical Analysis – USDJPY’s pullback unable to hurt uptrend

Posted on February 8, 2021 at 9:25 am GMT

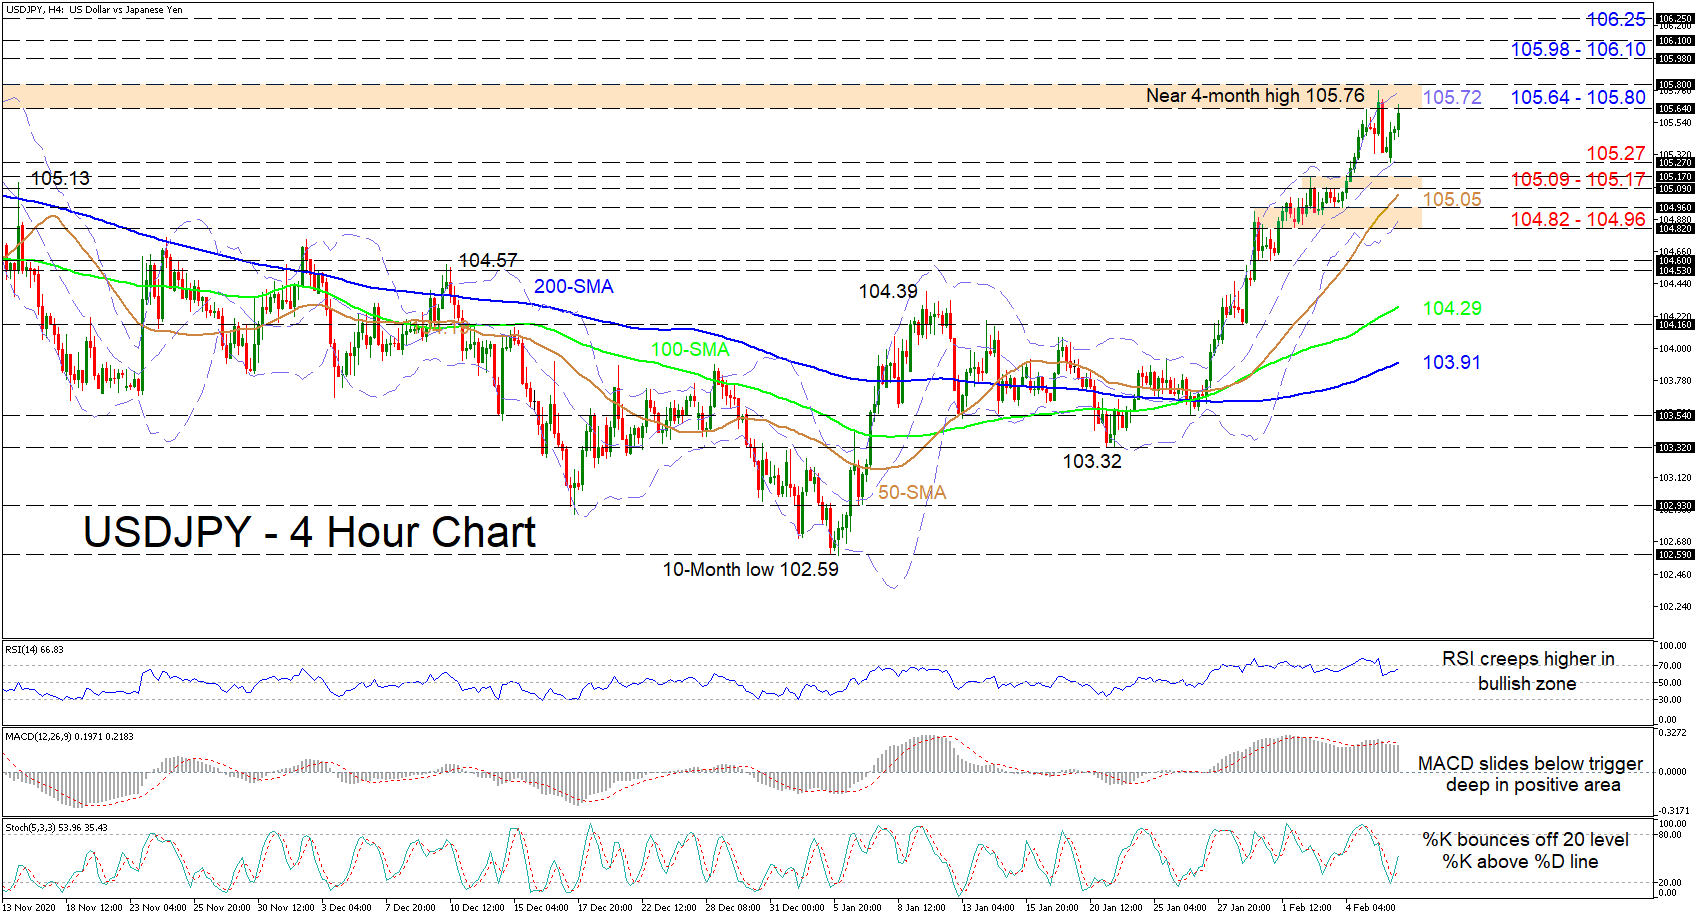
USDJPY in the early hours of today’s trading session found footing on the mid-Bollinger band around 105.27, resuscitating the positive climb. The short-term oscillators are reflecting the latest rebound in price, while the rising simple moving averages (SMAs) are protecting the rally off 103.32. Although the MACD has dipped below its red trigger line, it remains far above the zero mark, while the RSI is gradually improving in bullish territory. Furthermore, with the %K line having rebounded off the 20 [..]

Technical Analysis – EURUSD finds a turning point but jitters remain

Posted on February 8, 2021 at 8:29 am GMT

EURUSD bulls dominated on Friday, helping the price to return to the 1.2000 zone after the strong rebound at the bottom of the Ichimoku Cloud, which took the form of a bullish engulfing candle – a signal that the positive momentum may continue in the near term. Some caution, however, should be warranted as the RSI continues to fluctuate within the bearish territory despite last week’s upside reversal, while the MACD has yet to cross above its red signal line. Trend signals [..]

Technical Analysis – Gold fails to increase buying interest; holds in descending channel

Posted on February 8, 2021 at 7:33 am GMT

Gold has been holding in a bearish sloping channel over the last six months, developing beneath the simple moving averages (SMAs) and the Ichimoku cloud in the daily timeframe. Technically, the stochastic oscillator posted a bullish crossover within the %K and %D lines in the oversold zone, while the RSI is pointing up in the negative territory, indicating an upside retracement in the very short-term. However, if the price fails to jump above the 1,817 resistance, this could pull the price back towards the 1,764 [..]

post-image

Technical Analysis – GBPUSD restores positive tone; bullish in near-term  

Posted on February 5, 2021 at 1:58 pm GMT

GBPUSD is recovering above the 50-period simple moving average (SMA) at 1.3686 after the price was violently catapulted from beneath the 200-period SMA at 1.3607. In the broader picture, the price sustains a solid upwards force above the tentative trend line, drawn from the 1.2854 low in November last year. Nonetheless, the directionless Ichimoku lines are reflecting a slightly slowed tempo in the ascent, which struggled to overcome the 1.3745-1.3758 resistance ceiling at the end of January, while the upwards [..]

post-image

Technical Analysis – GBPCHF breaks above sideways range but gains look overstretched

Posted on February 5, 2021 at 1:53 pm GMT

GBPCHF has made a decisive break above the sideways range that had been in place since late March of 2020 after several days of flirting with the range top. Having raced above 1.23 to reach the highest in 11 months today, the pair could now have its sights on the 61.8% Fibonacci retracement of the December 2019 – March 2020 downtrend, which lies at 1.2468. Further gains could drive prices towards the 78.6% Fibonacci of 1.2837, which has been a [..]

post-image

Technical Analysis – USDCAD’s advances capped by Ichimoku cloud

Posted on February 5, 2021 at 9:35 am GMT

USDCAD is somewhat consolidating around the 50-day simple moving average (SMA) at 1.2776, as the pair’s efforts to improve are being curbed by the Ichimoku cloud. The Ichimoku lines are reflecting the price’s struggle to gain ground and it appears its bearish demeanour may be bulletproofed by the downward sloping SMAs. Positive momentum in the short-term oscillators seems to be faltering, increasing odds to the downside. The MACD, marginally above its red trigger line has barely peeped above the zero [..]

Technical Analysis – NZDUSD waits for a triangle breakout

Posted on February 5, 2021 at 8:48 am GMT

NZDUSD continues its consolidation phase inside a symmetrical triangle and below the 33-month high of 0.7314. While the price is looking set for another rebound within the formation and near the 50-day simple moving average (SMA), the momentum indicators provide little hope for cheer. The RSI is muted around its 50 neutral mark, and the MACD is gradually diminishing below its red signal line, while the red Tenkan-sen remains flattish slightly below the blue Kijun-sen line. A move above the 20-day SMA [..]

post-image

Technical Analysis – US 30 index completes bullish run near record high

Posted on February 5, 2021 at 7:53 am GMT

The US 30 index (Cash) rebounded off the 29,642 support level, posting four straight positive days and climbing above the 20- and 40-day simple moving averages (SMAs). The price is moving towards the record high of 31,284, while the technical indicators are confirming the upside tendency. The RSI is standing in the positive region, while the stochastic is holding in the overbought area, indicating a possible downside retracement. An extension beyond the all-time peak of 31,284 could take the index [..]

Risk Warning: Your capital is at risk. Leveraged products may not be suitable for everyone. Please consider our Risk Disclosure.