XM does not provide services to residents of the United States of America.

Technical Analysis

post-image

Technical Analysis – JP 225 index tries to shake bigger bullish bias

Posted on February 26, 2021 at 1:39 pm GMT

The Japan 225 stock index (Cash) recently dwindled from its new multi-decade high that was overall in-line with the 30,645 level, which happens to be the 176.4% Fibonacci extension of the down leg from 24,036 to the multi-year low of 15,384. The Ichimoku lines are reflecting a clear waning in positive sentiment but the pullback seems to be unable to jolt the ascent, as it has hit a snag around the region of 28,849-29,177. Furthermore, the soaring simple moving averages [..]

post-image

Technical Analysis – NZDUSD plunges from 3½-year high

Posted on February 26, 2021 at 10:09 am GMT

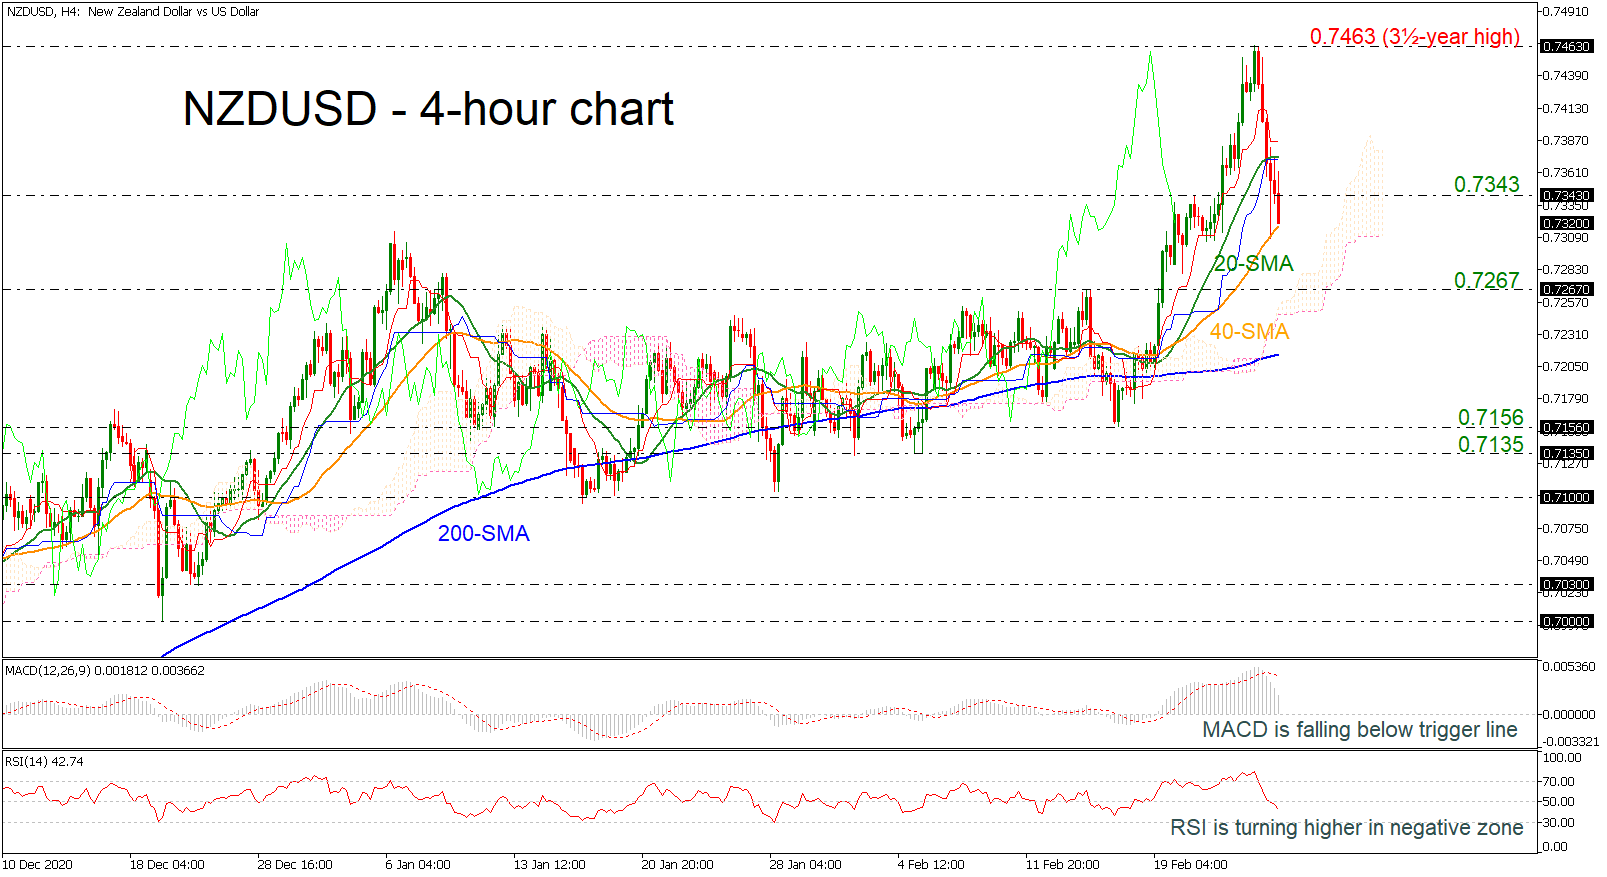
NZDUSD is diving below the more than three-and-a-half-year high of 0.7463, slipping below the 20-period simple moving average (SMA). This aggressive move is confirmed by the MACD oscillator, which is falling below the trigger line. However, the RSI is turning higher around the neutral threshold of 50. In trend indicators, the red Tenkan-sen line and the blue Kijun sen line are flattening above the current market price. Steeper decreases could take the market until the 40-period simple moving average (SMA) [..]

Technical Analysis – USDCAD defies the broader bearish outlook

Posted on February 26, 2021 at 9:34 am GMT

USDCAD is opposing the overwhelmingly bearish picture with its recent bounce off a newly formed 3-year low, between the troughs of 1.2450 and 1.2527. The pause in the falling Ichimoku lines is reflecting the recent rebound in the price, while the sliding simple moving averages (SMAs) are safeguarding the prevailing negative tone. The short-term oscillators are reflecting mixed signals in directional momentum. The MACD, in the negative region, is holding below its red trigger line, while the RSI’s bounce ahead [..]

Technical Analysis – GBPJPY puts rally in jeopardy after nearly 3-year high

Posted on February 26, 2021 at 8:39 am GMT

GBPJPY propelled exponentially following the break above the bullish channel, but its ascent looks to be in jeopardy now after the peak at an almost three-year high of 150.42 on Thursday. Notably, the price is set to close below the red Tenkan-sen line at 148.36, which has been a strong supporter since the start of the year, while the momentum indicators seem to be a bit discouraging about whether the bulls may take the wheel soon. Particularly, the falling RSI looks to have [..]

post-image

Technical Analysis – GBPUSD sinks around 1.39 after steep losses

Posted on February 26, 2021 at 7:23 am GMT

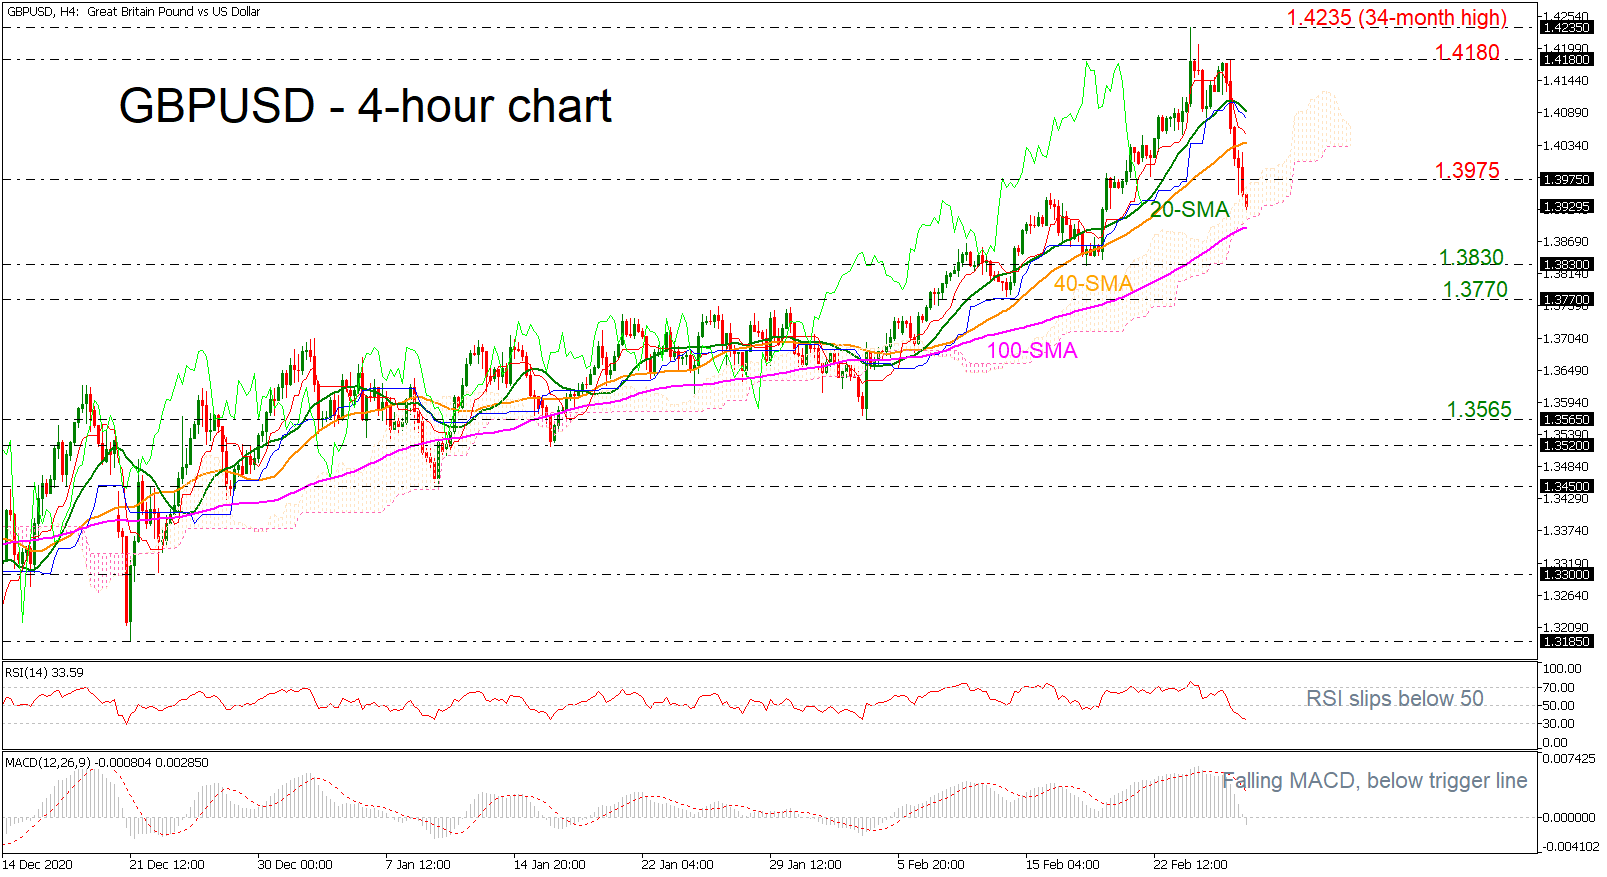
GBPUSD retreated quickly from its 34-month high of 1.4235, achieved on Tuesday, creating a steep bearish movement around the 1.3900 handle. The price sank beneath the 20- and 40-period simple moving averages (SMAs) in the 4-hour chart, entering the Ichimoku cloud. The RSI is diving in the negative territory, while MACD is declining below its trigger and zero lines.   Further losses could take the market until the 100-period SMA currently at 1.3890 before testing the 1.3830 support. If traders [..]

post-image

Technical Analysis – EURJPY rallies to fresh multi-year high; upside risks intact

Posted on February 25, 2021 at 4:51 pm GMT

EURJPY is boosting its overall broader bullish demeanour, with its latest traction off the Ichimoku cloud’s upper surface and the 50-period simple moving average (SMA). The rising Ichimoku lines are conveying strong bullish momentum, while the advancing SMAs are safeguarding the positive price structure. The short-term oscillators are also endorsing strong bullish sentiment. The MACD above zero is rocketing over its red trigger line, while the RSI is pushing higher in the overbought territory. Furthermore, the stochastic oscillator is proposing [..]

post-image

Technical Analysis – US 30 index posts all-time high above 32,000

Posted on February 25, 2021 at 1:33 pm GMT

The US 30 index (Cash) surged to a fresh all-time high above the 32,000 handle, remaining above the short-term simple moving averages (SMAs). The price rebounded off the long-term ascending trend line at 29,642 driving the price even higher, with the technical indicators confirming this bullish spike in the daily timeframe. Technically, the RSI is trying to overcome the 70 level to enter the overbought region, while the %K line of the stochastic oscillator advances above the 80 region, with the %D [..]

Technical Analysis – AUDUSD’s ascent conveys no near-term signs of waning   

Posted on February 25, 2021 at 10:14 am GMT

AUDUSD has climbed to a 3-year high tracing the upper Bollinger band and is currently tackling the 0.7988 high, stretching back to February 2018. Furthermore, the advancing simple moving averages (SMAs) are defending the prevailing bullish bias. The short-term oscillators are transmitting no signals of fading in the bullish momentum. The MACD, some distance in the positive region, is rising above its red trigger line. The RSI and the stochastic lines remain positively skewed as they are rising in overbought [..]

post-image

Technical Analysis – USDCHF holds above descending line; 200-day SMA is a crucial level

Posted on February 25, 2021 at 9:03 am GMT

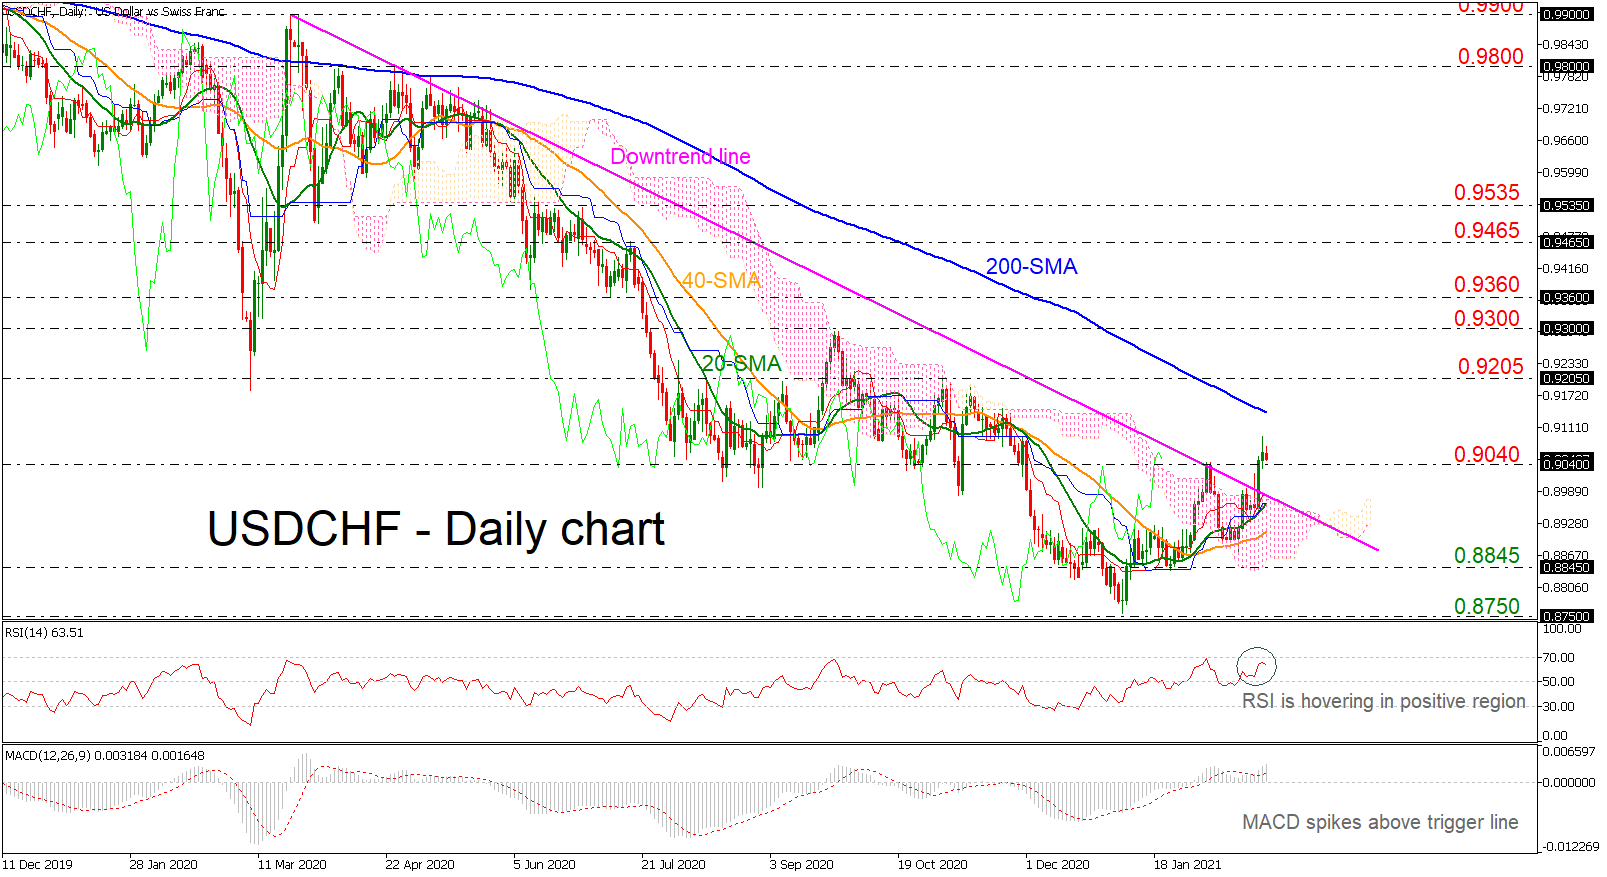
USDCHF had an aggressive bullish start on Tuesday, with the price breaking a crucial descending trend line. The pair has also increased distance above its positively sloped moving average (MA) lines and the Ichimoku cloud, showing that a bearish correction is on the cards. The momentum signals are bullish and the red Tenkan-sen line, which is above the blue Kijun-sen line, looks to be heading north, while the RSI has reversed higher and the MACD is advancing above its trigger and zero lines. Should the price [..]

Technical Analysis – WTI oil futures reach 2019 border; bullish overall

Posted on February 25, 2021 at 8:20 am GMT

WTI oil futures for April delivery have fully healed the pandemic damage, looking for fresh highs above the 63.00 level. The momentum indicators cannot doubt the case of another bullish wave as the upward direction in the red Tenkna-sen line continues above the blue Kijun-sen without interruption. Moreover, the MACD has regained strength above its red signal line, while the RSI, although having peaked within the overbought area, is not willing to exit that territory yet. While the above keep [..]

Risk Warning: Your capital is at risk. Leveraged products may not be suitable for everyone. Please consider our Risk Disclosure.