XM does not provide services to residents of the United States of America.

Technical Analysis

post-image

Technical Analysis – USDCAD struggles to cement gains as bearish bias overpowers

Posted on March 2, 2021 at 11:46 am GMT

USDCAD is somewhat caught between the 200- and 50-period simple moving averages (SMAs) after the impressive rally from the 3-year low of 1.2467. The downturn in the red Tenkan-sen line together with the flattening blue Kijun-sen line are indicating a fading positive drive, while the sliding SMAs are adding weight onto a deteriorating picture. The short-term oscillators are also suggesting bullish momentum is dwindling. The MACD, above the zero mark, is dipping lower under its red trigger line, while the [..]

post-image

Technical Analysis – EURCHF stands above 1.1000 and 20-SMA

Posted on March 2, 2021 at 8:54 am GMT

EURCHF had a bearish start on Tuesday, however, the price found support at the 20-period simple moving average (SMA) in the 4-hour chart. Momentum signals are contradicting each other as the stochastic oscillator dropped from the overbought region, while the RSI is declining in the positive area. However, the Ichimoku lines are moving sideways. Should the price extend declines, the 40-period SMA around 1.0980 could be of psychological significance ahead of the 1.0955 support level. If violation of the latter permits for further weakness, the next [..]

Technical Analysis – GBPUSD grasps for support near 20-SMA

Posted on March 2, 2021 at 8:13 am GMT

GBPUSD is marking the fourth day of declines near the 20-day simple moving average (SMA) which could be a make-or-break point in the coming sessions given the upside reversals around that line during the past three months. The 23.6% Fibonacci level of the 1.2674 – 1.4235 up leg is in the same position at 1.3867, giving more importance to the region and therefore suggesting that any violation here could see another negative extension. That said, the technical signals have yet to switch [..]

post-image

Technical Analysis – WTI futures test bearish forces after knock off yearly top

Posted on March 2, 2021 at 8:12 am GMT

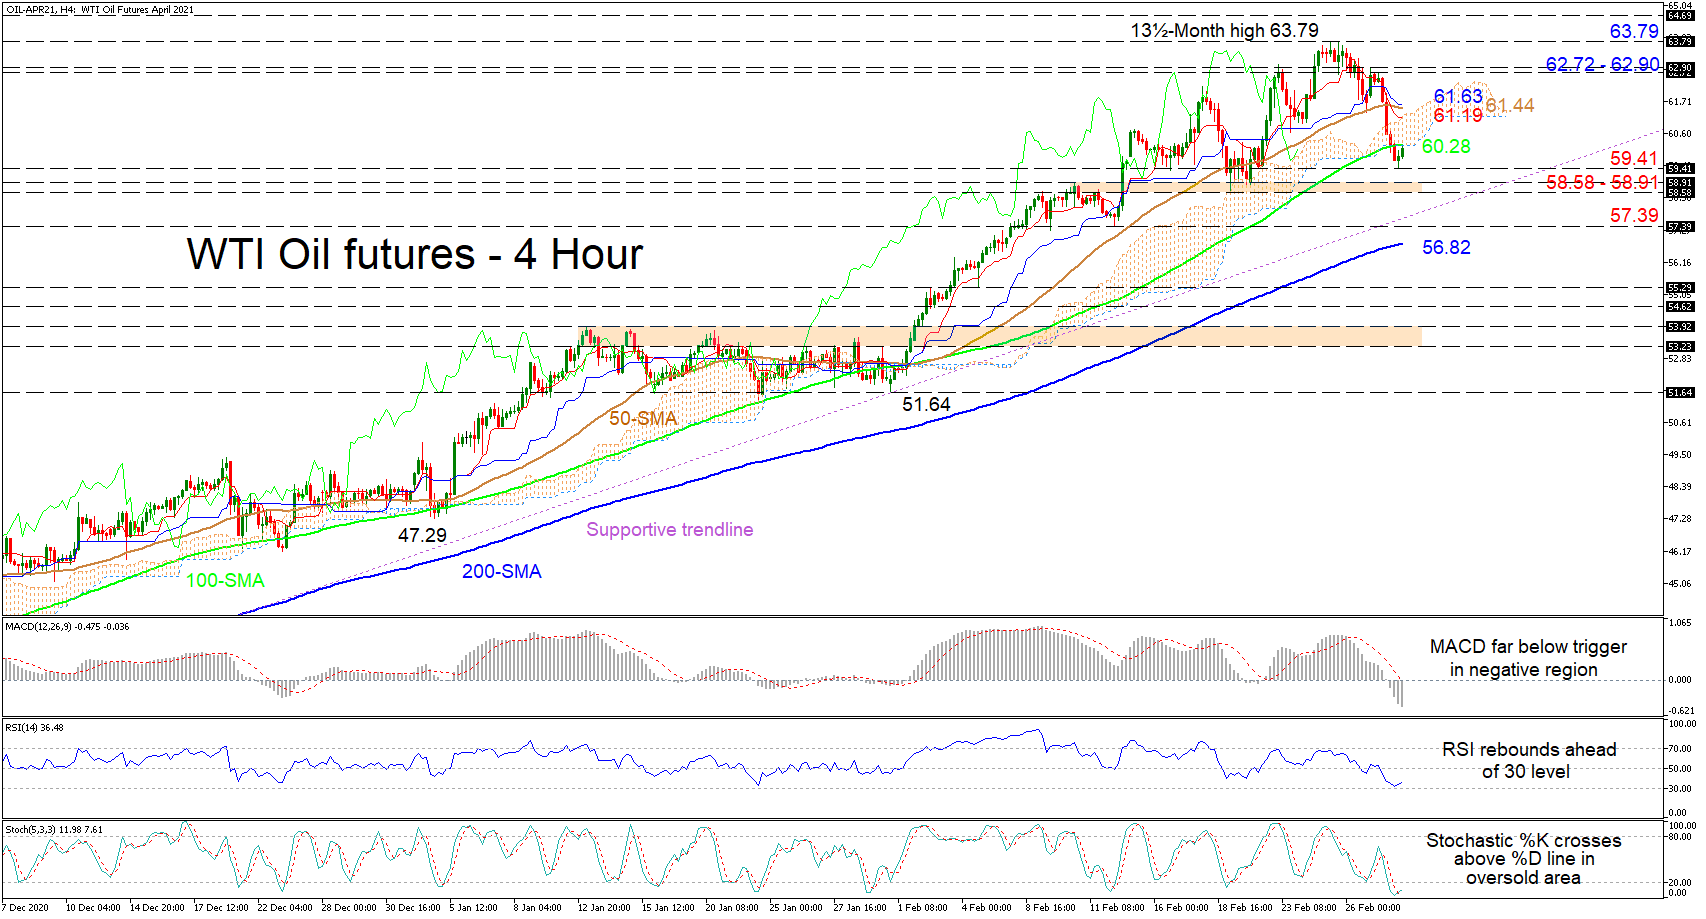
WTI oil futures’ recent bounce at 59.41 is tackling the curbing 100-period simple moving average (SMA) at 60.28, coupled with the Ichimoku cloud’s lower frontier. The SMAs are preserving the pair’s bullish bias in spite of the diminished upward slopes of the 50- and 100-period SMAs. The bearish tone of the Ichimoku lines is stalling suggesting a marginal pickup in positive price action, while the short-term oscillators are transmitting conflicting signals in directional momentum. The upturn of the RSI prior [..]

Technical Analysis – EURJPY slides below 28-month high

Posted on March 2, 2021 at 7:20 am GMT

EURJPY is retreating over the last days from the spike that sent the market to the 28-month high of 129.96. The RSI is confirming the recent view and is moving downwards in the positive territory, while the MACD is still standing above its trigger line. In trend indicators, the 20- and 40-day simple moving averages (SMAs) are endorsing the broader bullish outlook. In case that the price remains above the 128.45 support, the price could move until the multi-month peak [..]

post-image

Technical Analysis – US 500 index tests 50-MA and weight of bearish pressures  

Posted on March 1, 2021 at 3:44 pm GMT

The US 500 index (Cash) is trying to conquer the region from the 50-period simple moving average (SMA) until the 100-period SMA, after a foothold at the 3,788 level repowered the positive sentiment. The flattening out of the 100- and 200-period SMAs as well as the completed bearish crossover of the falling 50-period SMA are together signalling some waning in the up drive. Nevertheless, the Ichimoku lines are suggesting a pickup in positive momentum, while the short-term oscillators are promoting [..]

post-image

Technical Analysis – USDJPY’s weekly bullish cycle could lose impetus

Posted on March 1, 2021 at 10:50 am GMT

USDJPY ticked to a fresh 6-month high of 106.73 on Monday, but its weekly bullish cycle seems to be ending as the price is flirting with the topline of the ascending channel. The flattening RSI and the slowing positive momentum in the MACD also hint that the buying appetite may be losing steam, shifting the spotlight towards the supportive red Tenkan-sen line and the 20-period simple moving average (SMA), both converging at 106.27. A violation of this point could re-challenge the 106.00 round level ahead of the [..]

post-image

Technical Analysis – AUDUSD leaps back above 200-MA but bearish risks persist

Posted on March 1, 2021 at 9:56 am GMT

AUDUSD produced a false break of the 0.7988 high, identified in February 2018, touching a 3-year peak of 0.8006 before plummeting below the simple moving averages (SMAs) and pivoting at 0.7691. The SMAs are still supporting the pair’s bullish demeanour in spite of the diminished upward slopes of the 50- and 200-period SMAs. Nevertheless, the plunging red Tenkan-sen line is endorsing the aggressive negative price action, while the flattening blue Kijun-sen line is reflecting the pair’s recent bounce. Although the [..]

Technical Analysis – EURUSD faces restrictions within the cloud; bias neutral

Posted on March 1, 2021 at 8:49 am GMT

EURUSD did not find enough buyers to successfully breach the surface of the Ichimoku cloud and the restrictive line stretched from August despite moving beyond them to peak at 1.2242 last week. Encouragingly, however, sellers were not strong enough either to create a lower low below the cloud, keeping the upward direction from February’s bottom valid and supported near a tentative short ascending trendline. Currently, the RSI and the MACD provide little hope for improvement as the former has crossed [..]

Technical Analysis – Gold finds support at descending channel; still negative

Posted on March 1, 2021 at 7:27 am GMT

Gold is trying to recoup some losses of the preceding week and has been remaining within a downward sloping channel over the last seven months. In trend indicators, the 20- and 40-day simple moving averages (SMAs) are heading south as well as the Ichimoku lines. The stochastic oscillator is approaching the oversold zone; however, the RSI is turning up in the negative territory, suggesting a possible upside rebound. An upside pullback could take the market until the next immediate resistance [..]

Risk Warning: Your capital is at risk. Leveraged products may not be suitable for everyone. Please consider our Risk Disclosure.