XM does not provide services to residents of the United States of America.

Technical Analysis

Technical Analysis – GBPJPY trades around 150.00 and below 35-month high

Posted on March 5, 2021 at 7:50 am GMT

GBPJPY surged to a fresh 35-month high in yesterday’s session, hitting the 150.70 barrier. The aggressive buying interest started after the bounce off the 134.40 support and the advance above the 200-day simple moving average (SMA). Technically, the MACD oscillator is moving horizontally around its trigger line in the positive region, suggesting an overbought market, however, the stochastic is approaching the 80 level, indicating that there is more ground for bullish moves in the near-term. If buying pressure intensifies, immediate [..]
post-image

Technical Analysis – USDCHF continues uptrend above 200-SMA; overbought signals strengthen

Posted on March 4, 2021 at 11:23 am GMT

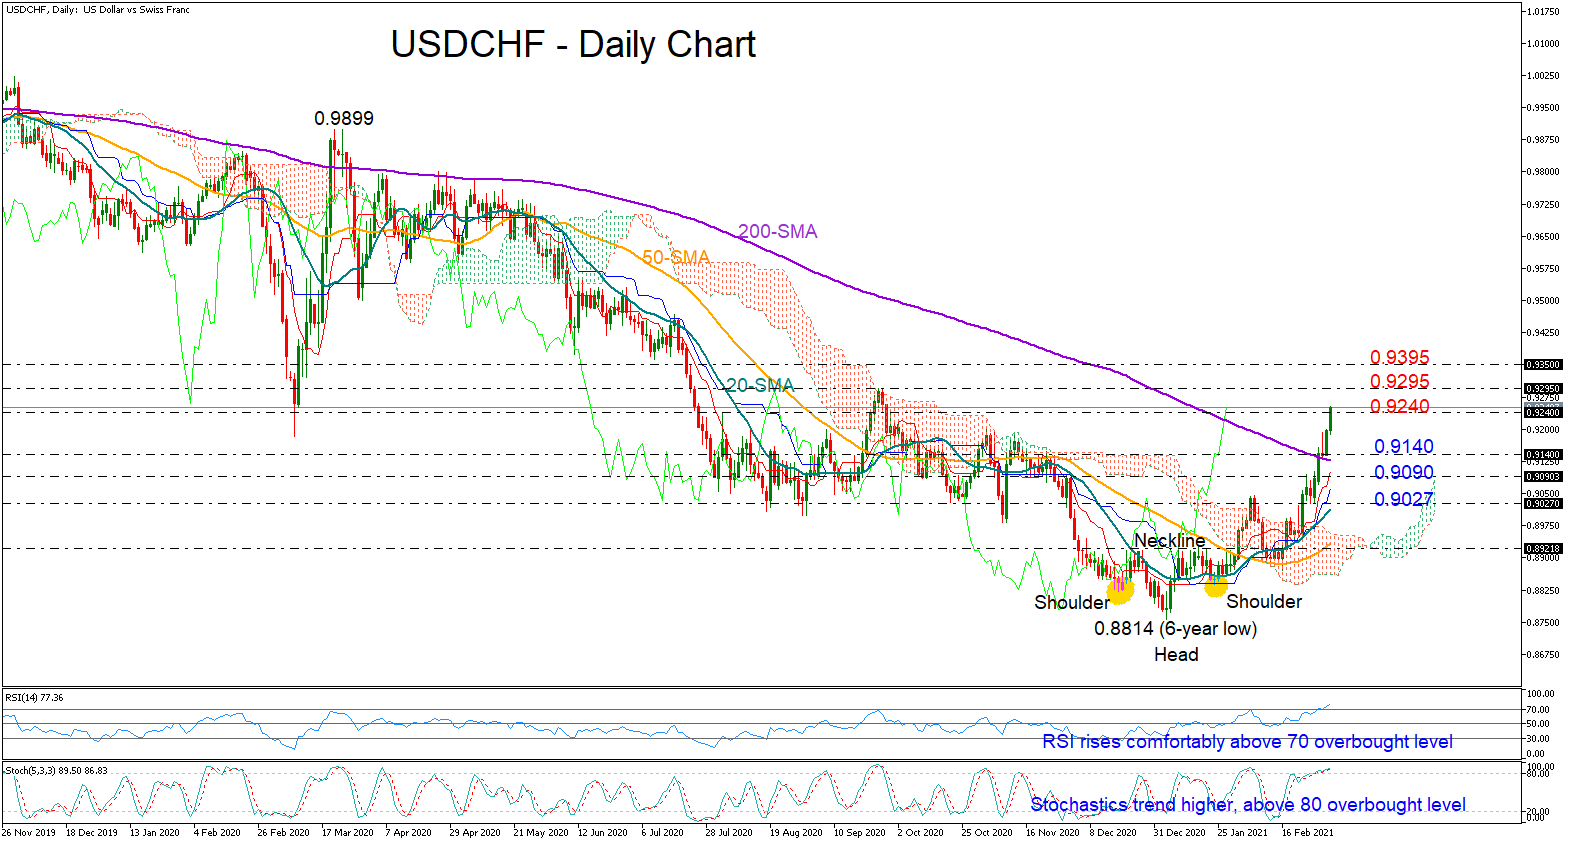
USDCHF found new buyers above the 200-day simple moving average (SMA), advancing its bullish impulse towards a fresh six-month high of 0.9236 on Thursday. The buying appetite in the market drove the RSI and the Stochastics well into the overbought area, though with the indicators showing no convincing signs of weakness, traders may wait a bit before selling the pair. Currently, the price seems to be facing some downside pressures slightly below the 0.9240 level, which acted as resistance a few times [..]

post-image

Technical Analysis – EURJPY remains above 129.00 and SMAs

Posted on March 4, 2021 at 10:01 am GMT

EURJPY is ticking up above 129.00 in the 4-hour chart, after the rebound off the 23.6% Fibonacci retracement level of the upward wave from 125.07 to 129.96 at 128.80 and the 20- and 40-period simple moving averages (SMAs). The RSI is pointing north in the positive region, while the MACD is hovering around its trigger line above its zero level. More advances could move the market until the immediate resistance at 129.45, which overlaps with the upper surface of the [..]

Technical Analysis – USDJPY extends bull run, but caution warranted in near term

Posted on March 4, 2021 at 8:36 am GMT

USDJPY seems primed to stretch its newly bullish trend further into the 107.00 area, having already retraced half of its 2020 bearish run. With the RSI and the fast Stochastics fluctuating within the overbought territory, and the price flirting with the channel’s topline near 9-month highs, profit-taking actions are increasingly possible in the short term. The 50% Fibonacci of the previous downtrend is also challenging the price near 107.14, and should it hold firm, the pair may weaken to seek [..]

Technical Analysis – WTI futures head up towards 13-month high

Posted on March 4, 2021 at 7:56 am GMT

WTI oil futures with delivery in April keep climbing steadily, extending above the 60.00 psychological level. The price rebounded off the 20-day simple moving average (SMA) and is heading again towards the 13-month peak of 63.88. The Ichimoku lines are flattening, while the climbing simple moving averages (SMAs) are defending the bullish structure. The RSI is further validating improvements in the price, however, the MACD is losing ground below its trigger line in the positive region. If buying interest increases, the first tough [..]

post-image

Technical Analysis – Gold charts a new 9-month low; selling pressure could be losing momentum

Posted on March 3, 2021 at 4:09 pm GMT

Gold created a new lower low at 1,701 on Wednesday after the 20-period simple moving average (SMA) on the four-hour chart proved a tough resistance to overcome. Despite the weakness in the RSI, the indicator has been printing higher higher and higher lows since the dip in the overbought territory, reducing downside risks in the market. The red Tenkan-sen line also seems to be easing its negative momentum, indicating that the bearish action may be losing steam. Sellers, however, may [..]

post-image

Technical Analysis – EURGBP tiptoes sideways as bearish tone lingers

Posted on March 3, 2021 at 11:20 am GMT

EURGBP is consolidating, creeping along the somewhat softened downward slope of the 50-period simple moving average (SMA) around 0.8641. The directionless Ichimoku lines have neared each other and are currently reflecting feeble directional momentum. Despite recent improvements off a foothold at a 1-year low level of 0.8538, the SMAs continue to defend the bearish bias, which began around the end of last year. The short-term oscillators are suggesting directional momentum has relatively dried up but are leaning more to the [..]

Technical Analysis – AUDUSD avoids trend deterioration, but upturn looks fragile

Posted on March 3, 2021 at 8:24 am GMT

AUDUSD is healing its injuries after the 50-day simple moving average (SMA), the surface of the Ichimoku cloud, and the ascending trendline from November blocked last week’s aggressive pullback from a three-year high of 0.8006. The ongoing recovery mode, however, warrants some caution as the MACD continues to weaken below its red signal line, while the red Tenkan-sen and Kijun-sen lines keep extending their sideways move above the price action. Meanwhile, the RSI is looking more encouraging after its bounce [..]

post-image

Technical Analysis – GBPJPY’s pullback edges towards the cloud; ascent still intact

Posted on March 3, 2021 at 7:32 am GMT

GBPJPY is consolidating after fading from its near 34-month peak of 150.43 and is currently tackling the 149.28 barrier. The pair continues to find footing off the cloud’s upper boundary, while the Ichimoku lines are backing a more neutral price tone. Specifically, the 50-period simple moving average (SMA) is buoying the price, while overall the SMAs are defending the predominant bullish structure. Also lately the short-term oscillators are suggesting improvements in positive momentum. The MACD, is increasing above its red [..]

Technical Analysis – NZDUSD rebounds off uptrend line; flirts with 0.73

Posted on March 3, 2021 at 6:59 am GMT

NZDUSD is continuing the rebound off the ascending trend line, overcoming the 20- and 40-day simple moving averages (SMAs) and moving towards 0.7300. The short-term bias looks positive as the MACD is trying to surpass its trigger line in the positive territory, while the RSI seems to be making its way up above its 50-neutral mark, though more progress is needed from both. The three-and-a-half-year high of 0.7463 could be a trigger point for steeper bullish action. Higher, resistance could run towards the 0.7557 [..]

Risk Warning: Your capital is at risk. Leveraged products may not be suitable for everyone. Please consider our Risk Disclosure.