XM does not provide services to residents of the United States of America.

Technical Analysis

post-image

Technical Analysis – AUDUSD’s downside risks persist as descent stalls

Posted on March 8, 2021 at 2:50 pm GMT

AUDUSD paused its negative trajectory from February’s 3-year high around the area between the latest lows of 0.7621 and 0.7635 respectively. The falling red Tenkan-sen line is assisting the price dive beneath the 200-period simple moving average (SMA), while the flattening blue Kijun-sen line is reflecting a pause in the downwards price move. The bearish crossover between the falling 50-period SMA at 0.7792 and the 100-period SMA at 0.7800 is endorsing a deeper drop in the price. The short-term oscillators [..]

post-image

Technical Analysis – US 500 index hovers between short-term SMAs

Posted on March 8, 2021 at 2:48 pm GMT

The US 500 index (Cash) is trading below the record high of 3,963.58, flirting with the 20- and 50-day simple moving averages (SMAs). The momentum indicators are suggesting a downside reversal as the MACD is losing ground below its trigger line and the RSI is turning lower around the neutral threshold of 50. Further losses could take the index towards the 3,664 support ahead of the 3,595 barrier, which stands around the long-term ascending trend line. A break below this line [..]

post-image

Technical Analysis – USDJPY rises around 9-month high

Posted on March 8, 2021 at 10:46 am GMT

USDJPY has increased to a fresh nine-month high of 108.64 on Friday, endorsing the upside tendency. The simple moving averages (SMAs) are following the price action as well as the Ichimoku lines. The Relative Strength Index (RSI) is holding in the overbought territory, suggesting an overstretched market, while the stochastic oscillator is edging north towards the 80 level. Any advances above the multi-month high of 108.64 could take the market until the next crucial resistance around 109.85, taken from the [..]

Technical Analysis – Gold could snowball past its latest 9-month low

Posted on March 8, 2021 at 9:17 am GMT

Gold’s negative tendencies are picking up again after the yellow metal found some footing around the level of 1,687, logging a nine-month low, ahead of the significant support zone of 1,660-1,682. The gold scale seems to be tilting increasingly negative, as the bearish Ichimoku lines, which have controlled the commodity from the level of 1,876, are continuing to curb improvements in the price. The falling 50- and 100-day simple moving averages (SMAs), and their recent bearish crossovers of the 200-day [..]

Technical Analysis – EURUSD sinks below 1.1900 in ascending channel

Posted on March 8, 2021 at 8:01 am GMT

EURUSD is diving further below the 1.1900 psychological level, approaching the lower surface of the upward sloping channel. The selling interest started after the pullback off the 1.2240 resistance, taking the market well below the short-term simple moving averages (SMAs) and the 100-day SMA. The RSI is heading towards the 30 level with strong momentum, while the stochastic is hovering in the oversold territory. A successful fall beneath the ascending channel could take the price towards the 1.1745 support ahead of the [..]

post-image

Technical Analysis – GBPUSD corrects below 200-MA; bullish bias endures

Posted on March 5, 2021 at 2:48 pm GMT

GBPUSD improved off the 200-period simple moving average (SMA) around 1.3830, after the correction from the 34-month peak of 1.4236 spiked below it and near the low of 1.3775. The Ichimoku lines are reflecting a pause in negative momentum, while the falling 50-period SMA is endorsing further bearish tendencies in the pair, which also previously had curbed price gains off the 1.3865 level. The short-term oscillators are conveying an increase in positive momentum. The MACD, some distance below zero, is [..]

post-image

Technical Analysis – US 30 stock index halts rally near familiar resistance line

Posted on March 5, 2021 at 2:42 pm GMT

The US 30 index (cash) gave up some ground after unlocking a new record high of 32,072 near the key resistance line, which connects all the peaks from June onwards. The upper boundary of the Ichimoku cloud and the 23.6% Fibonacci of the 26,065 – 32,072 up leg, however, managed to stabilize the downward correction and help the pair set a foothold above the 50-day simple moving average (SMA). While the weak momentum in the MACD and the sideways move [..]

post-image

Technical Analysis – JPMorgan’s stock eyes trend reversal after record highs

Posted on March 5, 2021 at 11:02 am GMT

JPMorgan’s stock has been quite progressive since the start of November, making higher highs and higher lows within uncharted waters. The situation, however, is currently looking bleak on the four-hour chart as the creation of a potential double top pattern near the 19-year-old resistance line is increasing the case of a trend reversal. That said, the bearish formation requires a confirmational close below the 147.24 neckline, while the upward-sloping simple moving averages (SMAs) have yet to send any negative trend warnings, keeping some [..]

post-image

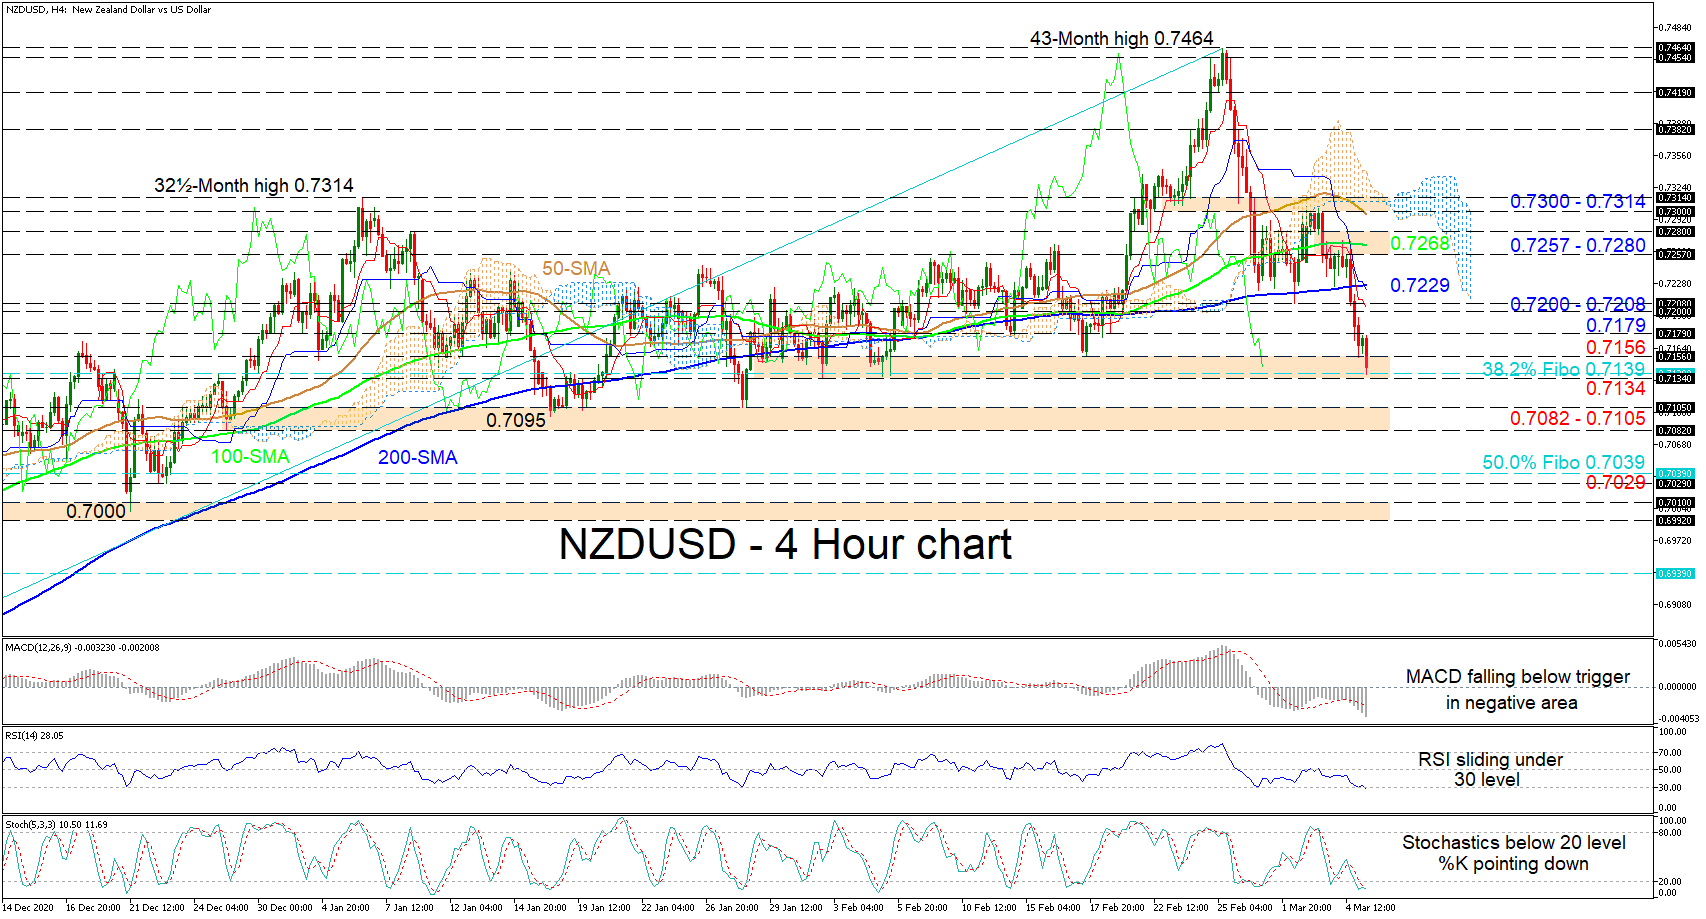
Technical Analysis – NZDUSD deteriorates below MAs; correction tests 38.2% Fibonacci

Posted on March 5, 2021 at 9:59 am GMT

NZDUSD bounced on the upper band of the key support section of 0.7134-0.7156, only to plunge towards the 0.7139 obstacle. This encapsulated level happens to be the 38.2% Fibonacci retracement of the up leg from 0.6612 to the multi-year high of 0.7464. The falling Ichimoku lines suggest negative price action is increasing, while the bullish demeanour of the SMAs is clearly waning, mainly reflected in the diving 50-period SMA. The short-term oscillators are also signalling a pickup in negative sentiment. [..]

Technical Analysis – USDCAD trapped in a bear market; trendline resistance in focus

Posted on March 5, 2021 at 8:35 am GMT

USDCAD attempted to quickly recover from a three-year low of 1.2467 as it did back in 2016, but the tough ascending trendline and the bottom of the Ichimoku cloud put the brakes on bullish forces, leaving the pair on the sidelines this week. The RSI and the MACD keep the odds for a meaningful rally muted as the former has been struggling to sustain strength above its 50 neutral mark, while the latter could not climb into the positive territory [..]

Risk Warning: Your capital is at risk. Leveraged products may not be suitable for everyone. Please consider our Risk Disclosure.