XM does not provide services to residents of the United States of America.

Technical Analysis

post-image

Technical Analysis – GER 30 index marks new all-time high; overbought signals strengthen

Posted on March 10, 2021 at 3:33 pm GMT

The German 30 index (cash) has finally soared above the 14,130 ceiling, which kept bullish actions under control from early January onwards, charting a new record high at 14,554 on Wednesday. The next target could be the 261.8% Fibonacci extension of the latest pullback at 14,740 but the bulls may take a breather before reaching that level as the RSI and the recent closures above the upper Bollinger band suggest that the rally is overstretched. The 14,387 area has been restrictive over [..]

post-image

Technical Analysis – NZDUSD under heavy strain; sellers try to suppress ascent  

Posted on March 10, 2021 at 10:05 am GMT

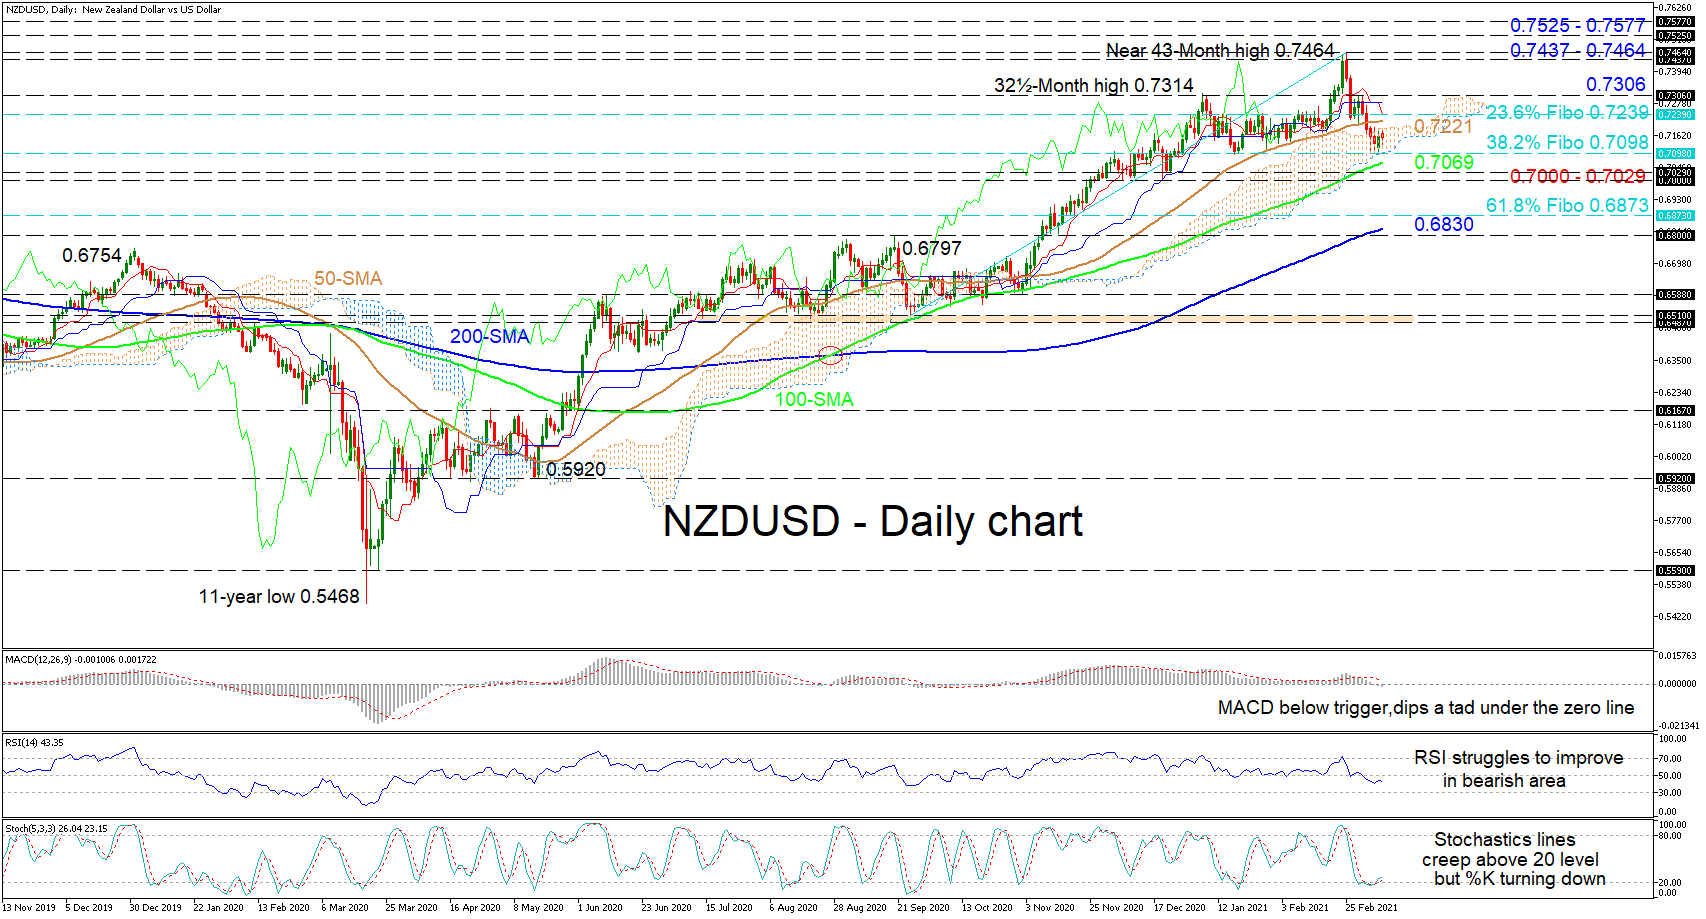
NZDUSD has found a foothold at the 0.7098 barrier that happens to be the 38.2% Fibonacci retracement of the up leg from 0.6510 until 0.7464, which is aligned with the Ichimoku cloud’s lower surface. The predominantly bullish simple moving averages (SMAs) are defending the positive structure. However, the dipping red Tenkan-sen line is suggesting growing negative momentum, while the flattening blue Kijun-sen line is promoting a stall in the retreat from the 43-month peak of 0.7464. The short-term oscillators are [..]

post-image

Technical Analysis – Gold stands marginally above 1,700

Posted on March 10, 2021 at 9:27 am GMT

Gold prices are struggling to gain positive momentum after its fast rebound stalled around the 40-period simple moving average (SMA) in the 4-hour chart. The downside reversal in the RSI and the slowdown in the Stochastics justify the diminishing buying pressure, though both remain above their neutral thresholds, keeping the short-term risk skewed to the upside. However, the bullish move that pushed prices above the 20- and 40-period SMAs signals an improving structure. Should selling forces strengthen, the 20-period SMA around 1,700 could come under the [..]

Technical Analysis – USDJPY remains below 109.00; extremely positive in short-term

Posted on March 10, 2021 at 8:25 am GMT

USDJPY decreased yesterday after the aggressive upside spike to a new nine-month high of 109.22. Currently, the price is still developing below the 109.00 psychological level, but the bias is bullish in the short-term timeframe. The 40-day simple moving average (SMA) is ready to post a bullish crossover with the 200-day SMA, suggesting more losses. Technically, the RSI indicator is holding in the overbought territory with weaker momentum than before, while the MACD is stretching its move above its trigger [..]

post-image

Technical Analysis – USDCHF rally takes a hit; bullish bias looks intact

Posted on March 9, 2021 at 4:20 pm GMT

USDCHF has retreated below its red Tenkan-sen line after a near one-month rally touched levels not seen in 7½-months. The soaring simple moving averages (SMAs) are reinforcing the rally, while positive sentiment appears barely damaged, something also reflected currently in the Ichimoku lines. The short-term oscillators are mirroring the latest price move and are endorsing a deeper pullback in the pair. The MACD, in the positive section, is deteriorating below its red trigger line, while the RSI is declining towards [..]

post-image

Technical Analysis – WTI futures’ upside intact as pullback struggles to gain impetus

Posted on March 9, 2021 at 2:54 pm GMT

WTI oil futures have just dipped below the mid-Bollinger band around the 65.00 handle, following a recent retreat from their newly reached multi-year high of 67.96. The climbing simple moving averages (SMAs) and the supportive trend line – pulled from the 34.02 trough – are defending the uptrend, while sellers seem somewhat incapable of steering the price beneath the support section of 63.79-64.56. The short-term oscillators are demonstrating strengthening signals in negative momentum. The MACD, deep in the positive region, [..]

post-image

Technical Analysis – USDCAD violates Ichimoku cloud’s floor as gains remain curbed by 200-MA

Posted on March 9, 2021 at 11:33 am GMT

USDCAD is currently piercing the Ichimoku cloud’s lower surface, while the pair remains confined within a consolidation pattern between 1.2574 and 1.2746. The simple moving averages (SMAs) are reflecting the undecided course in the pair with a bullish crossover of the 100-period SMA around 1.2638, by the 50-period one, while the 200-period SMA is capping improvements in the price. The directionless Ichimoku lines have yet to signal a strong clear direction, while the short-term oscillators are currently backing the latest [..]

Technical Analysis – GBPUSD looks for support near 50-SMA; downside risks remain

Posted on March 9, 2021 at 8:34 am GMT

GBPUSD closed below the supportive 20-day simple moving average on Friday (SMA), increasing the case for additional downside corrections. Despite the weakness in the MACD and the downward direction in the RSI, the area around the 50-day SMA slightly beneath at 1.3769 could provide another opportunity for the bulls to rebuild their strength as they did back in December. If this level holds firm, with the price crossing back above the nearby 1.3960 resistance and the red Tenkan-sen line too, [..]

post-image

Technical Analysis – EURJPY continues to climb as upside pressures overpower

Posted on March 9, 2021 at 8:19 am GMT

EURJPY is sustaining its bullish demeanour as it is steadily creeping higher above the uptrend line, drawn from the 121.61 trough. The rising simple moving averages (SMAs) and the Ichimoku cloud are defending the positive structure, nurturing the price’s advances off the cloud’s upper surface. Furthermore, the Ichimoku lines are conveying growing positive momentum despite the recent flattening of the blue Kijun-sen line. The short-term oscillators are also proposing additional gains in the pair. The MACD, some distance in the [..]

post-image

Technical Analysis – EURCHF retreats from 20-month high but positive bias persists

Posted on March 8, 2021 at 4:12 pm GMT

EURCHF receded recently after spiking to a near 20-month high of 1.1151. The strong rally off 1.0786, which breached the previous highs like 1.0891 and 1.0914 respectively, seems to maintain a sturdy bullish bearing. The rising Ichimoku lines reflect this growing positive momentum, while the latest upward slopes in the simple moving averages (SMAs) are endorsing this view as well. The short-term oscillators are also promoting the overall improvements in the price. The MACD is holding above its red trigger [..]

Risk Warning: Your capital is at risk. Leveraged products may not be suitable for everyone. Please consider our Risk Disclosure.