XM does not provide services to residents of the United States of America.

Technical Analysis

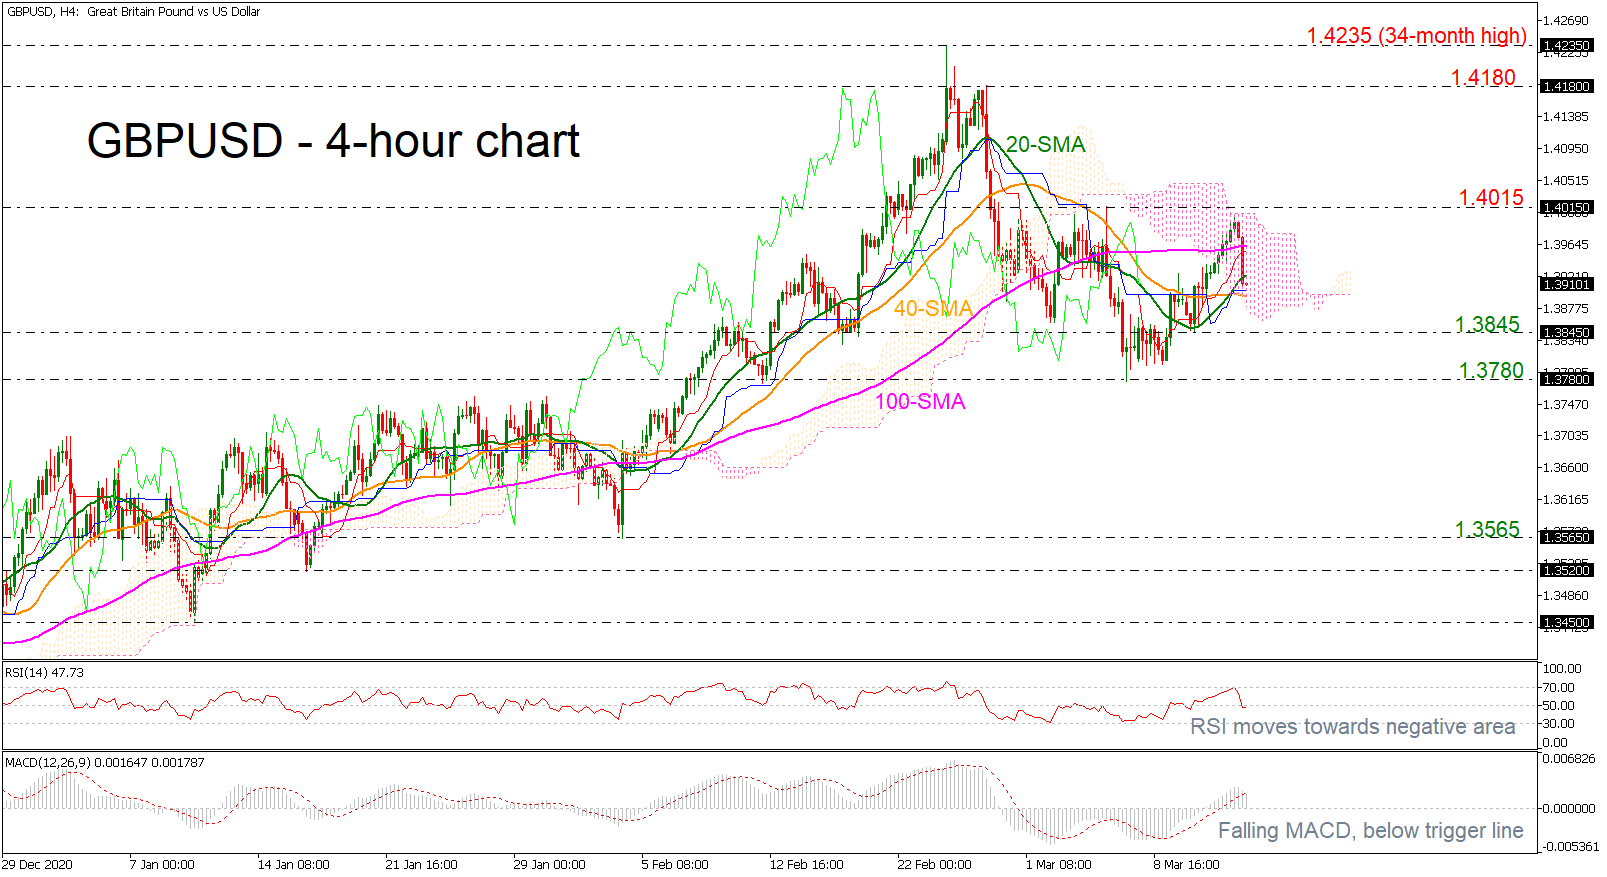
Technical Analysis – GBPUSD unable to defeat 1.4000 but upside risks persist

Posted on March 16, 2021 at 9:12 am GMT

GBPUSD is heading for a retest of the 50-day simple moving average (SMA), currently residing within a support base of 1.3757-1.3800. However, the soaring SMAs are defending the more than 5-month uptrend. The flattening red Tenkan-sen line, although beneath the rising blue Kijun-sen line – which is backing the positive picture – is suggesting that the bears may struggle to shift the momentum to the downside. Nevertheless, the now bearish short-term oscillators are signalling that the endured bullish tone has [..]

post-image

Technical Analysis – US 500 index flies to another record high marginally below 4,000

Posted on March 16, 2021 at 8:56 am GMT

The US 500 index has attracted renew buying interest once again, holding slightly below the 4,000 psychological level. The price continues to post five consecutive green days and holding well above the simple moving averages (SMAs). The MACD oscillator is trying to overcome its trigger line in the positive region, while the RSI is advancing in the bullish territory. Surpassing the all-time high, the price could enter uncharted levels such as the nearby 4,000 handle, the 4,100 and 4,200 barriers. [..]

Technical Analysis – EURJPY pauses rally; next bearish catalyst at 129.60

Posted on March 16, 2021 at 8:29 am GMT

EURJPY is struggling to gain ground within the 130.00 territory despite ticking to a fresh 29-month high of 130.47 on Monday. The recent weakness in the RSI and the Stochastics reflects the muted tone in the market and warrants some caution about the five-week-old rally as the former is looking to exit the overbought territory and the latter has already posted a bearish cross above its 80 overbought mark. The MACD has also eased its positive momentum but remains above [..]

post-image

Technical Analysis – EURGBP hovers near lows, downtrend still in force

Posted on March 15, 2021 at 4:24 pm GMT

EURGBP rebounded in recent sessions, after touching the one-year low of 0.8540. Despite the latest bounce though, negative forces are still dominant as the price structure of lower highs and lower lows remains intact. The pair is also trading below all its simple moving averages (SMAs) and below a downtrend line drawn from the December highs. Short-term oscillators reflect fading downside momentum. The RSI has rebounded from near 30, while the MACD is rising above its red trigger line, although [..]

post-image

Technical Analysis – Gold rebounds off lower band of descending channel

Posted on March 15, 2021 at 9:33 am GMT

Gold is trying to regain some losses in the very short-term but remains below the 20- and 40-day simple moving averages (SMAs) in a descending channel. The market could reverse lower as the stochastic is turning lower after the pullback on the overbought zone, however, the RSI is pointing upwards in the negative territory. Should the pair stretch north, the 20-day SMA could provide immediate resistance at 1,750 ahead of the 1,764 barrier. A step higher could meet the 40-day SMA at 1,796, [..]

post-image

Technical Analysis – EURUSD eases slightly in ascending pattern

Posted on March 15, 2021 at 7:23 am GMT

EURUSD is falling around the 1.1920 level after the rebound off the lower band of the ascending channel. The RSI is pointing marginally down in the negative territory, while the stochastic is heading south from the overbought zone. A successful decline beneath the ascending channel could take the price towards the 1.1745 support ahead of the 38.2% Fibonacci retracement level of the up leg from 1.0635 to 1.2348 at 1.1695. Beneath these lines, the 1.1610 support and the 50.0% Fibonacci of [..]

post-image

Technical Analysis – US 30 index takes a breather; upside risks remain

Posted on March 12, 2021 at 1:27 pm GMT

The US 30 stock index (Cash) is retreating somewhat from its new all-time high of 32,660, which happens to be the 138.2% Fibonacci extension of the down leg from 32,073 until 30,542 – the latter being the trough where the one week rally pushed off from. The advancing simple moving averages (SMAs) are endorsing the positive picture in the index, while the bullish crossover of 100-period SMA by the 50-period one – with a freshly steepened inclined – is further [..]

post-image

Technical Analysis – AUDJPY hits three-year high as uptrend continues

Posted on March 12, 2021 at 12:47 pm GMT

AUDJPY keeps roaring higher, hovering near the three-year high of 84.95 that was reached last month. The price structure of higher peaks and higher troughs remains uninterrupted, while the pair is also trading above all its simple moving averages (SMAs), keeping the overall picture positive. That said, the short-term oscillators reflect some mixed signals. The price met resistance after touching its upper Bollinger band and the RSI has turned lower from 70, both suggesting that a pullback is possible in [..]

post-image

Technical Analysis – GBPUSD tumbles around 1.39 and below 100-period SMA

Posted on March 12, 2021 at 10:31 am GMT

GBPUSD has come under renewed selling interest today around 1.3900, diving below the 100-period simple moving average (SMA) in the 4-hour chart. The price is hovering in the Ichimoku cloud and the technical indicators are suggesting a downside movement. The RSI is tumbling around the neutral-threshold of 50, after the pullback off the overbought territory, while the MACD is losing ground in the positive region. Steeper decreases could find immediate support at the 1.3845 barrier ahead of the 1.3780 hurdle, [..]

post-image

Technical Analysis – GBPJPY flashes green as buyers take full control

Posted on March 12, 2021 at 9:06 am GMT

GBPJPY in the last nine days has logged only one bearish doji candle and it seems set to push to new heights as upside pressures continue to overpower. It appears the pivot at 147.39 gained significant traction refuelling the rally and lifting the price to a 34½-month high of 152.22. The rising Ichimoku lines are assisting the 3-month rally from 136.77, while the advancing simple moving averages (SMAs) are endorsing the bullish structure. The short-term oscillators are also reflecting the [..]

Risk Warning: Your capital is at risk. Leveraged products may not be suitable for everyone. Please consider our Risk Disclosure.