XM does not provide services to residents of the United States of America.

Technical Analysis

Technical Analysis – Gold battles with 20-day SMA; bearish outlook

Posted on March 22, 2021 at 8:02 am GMT

Gold prices have been in a descending movement over the last six-and-a-half months after the touch of the record high of 2,074.89. In the short-term, the price is battling with the 20-day simple moving average (SMA) and the Ichimoku lines. Technically, the stochastic oscillator is losing ground and is slipping from the overbought territory, while the RSI indicator is turning marginally down below the 50 level. In case of further selling interest, the precious metal could find support at the [..]
post-image

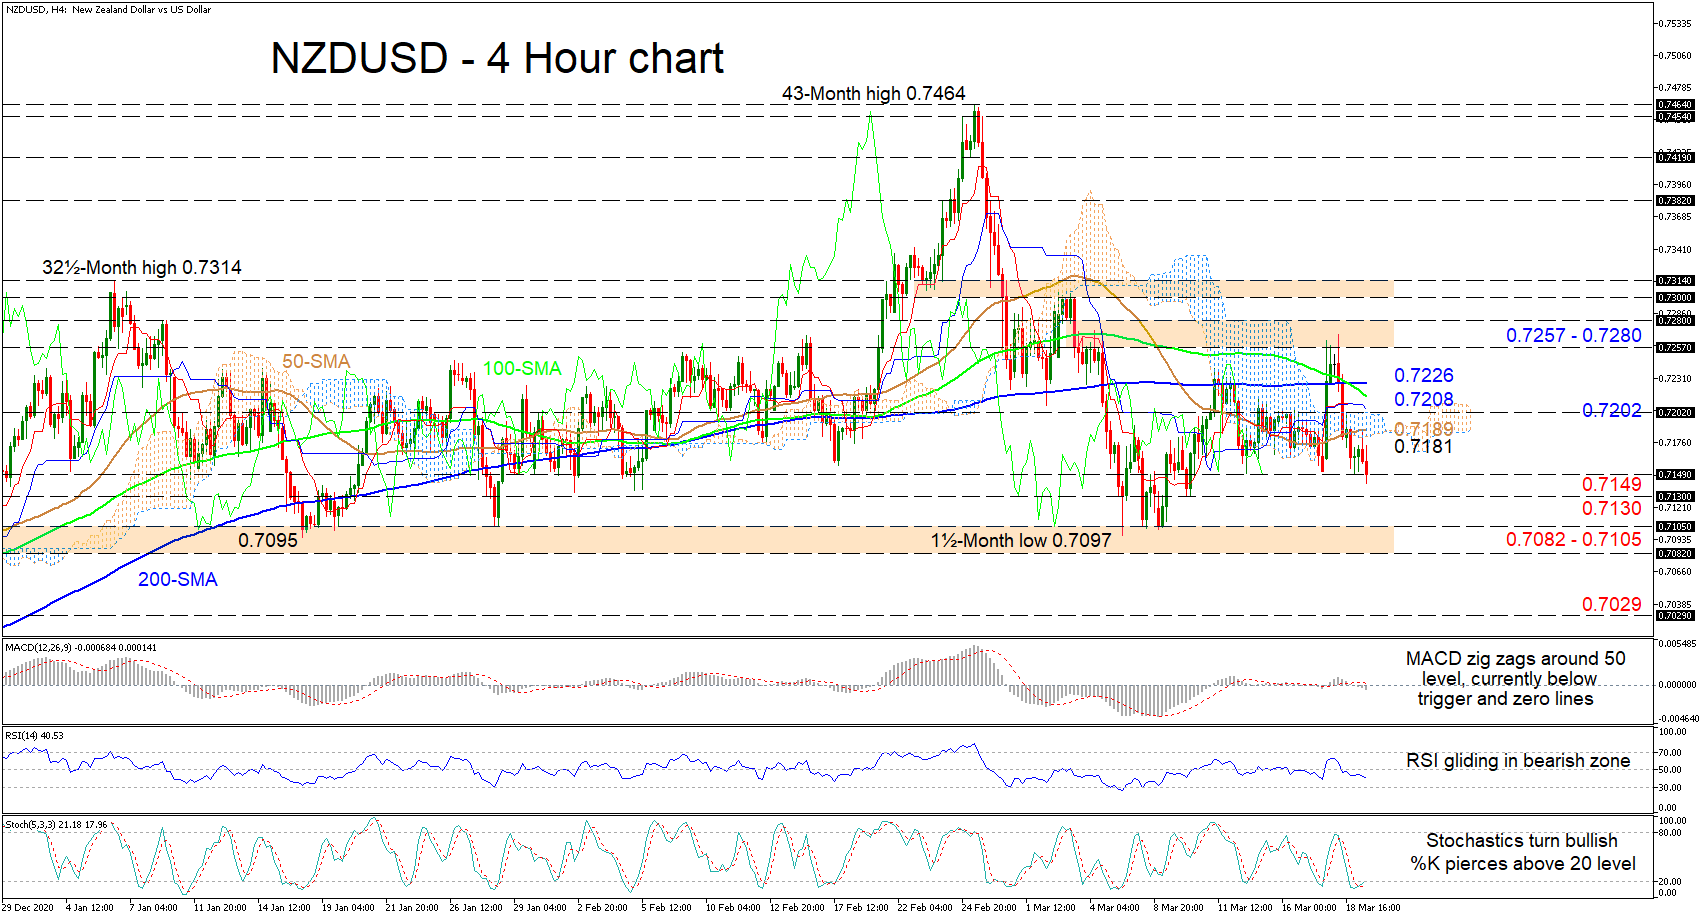
Technical Analysis – NZDUSD range-bound; tests key support  

Posted on March 19, 2021 at 1:54 pm GMT

NZDUSD’s bearish tone seems to have somewhat stabilised and the pair is now ranging within the boundaries of 0.7082 and 0.7280. The flattening and merged Ichimoku lines as well as the horizontal posture of the Ichimoku cloud are endorsing a more sideways price market. The directional scale appears to have tilted back to neutral, something also being conveyed through the opposing signals from the 50- and 100-period simple moving averages (SMAs) and the steadied 200-period SMA. The short-term oscillators are [..]

Technical Analysis – USDCAD’s bounce looks frail as bearish bias overpowers

Posted on March 19, 2021 at 9:55 am GMT

USDCAD’s recent positive impetus off a multi-year low has been muted by the Ichimoku lines, while the capping 50-day simple moving average (SMA) and the lingering Ichimoku cloud overhead have once again guided the pair downwards. The Ichimoku lines are promoting negative momentum, while all SMAs are reinforcing the bearish structure. Positive sentiment seems to remain subdued, something also being reflected in the short-term oscillators. The MACD, although flattening, is south of the zero threshold and remains below its red [..]

Technical Analysis – GBPJPY bulls fight long-term bullish channel after 13-week rally

Posted on March 19, 2021 at 8:28 am GMT

GBPJPY is set to finish the week in the neutral zone for the first time after 13 consecutive green weeks, as the tough resistance around the upper boundary of the one-year-old bullish channel resurfaced on the way up. Despite its muted tone, the price managed to unlock a 35-year high of 152.53 on Thursday and remain resilient above the red Tenkan-sen line, which has been assisting the bulls for more than three months now. In momentum indicators, the RSI could not [..]

post-image

Technical Analysis – GBPUSD ticks up in neutral bias in short term

Posted on March 19, 2021 at 8:20 am GMT

GBPUSD has been moving sideways over the last three weeks, hovering above the short-term simple moving averages (SMAs). The price is holding marginally above the Ichimoku cloud, while the RSI is turning higher around the 50 level and the MACD is flattening near its trigger and zero lines. If price action remains above the 1.3900 handle, there is scope to test the 1.4015 resistance. Clearing this key level would likely see additional gains towards 1.4180. Rising above it could take prices to re-test the 34-month high of [..]

post-image

Technical Analysis – US 30 index resumes its climb to unmapped peaks

Posted on March 18, 2021 at 4:24 pm GMT

The US 30 stock index (Cash) is stepping up to fresh all-time highs, currently around 33,210, after its latest bounce off the Ichimoku cloud’s upper frontier at 30,542. The bullish Ichimoku lines are endorsing the recent positive sentiment in the index, while the advancing simple moving averages (SMAs) are safeguarding the bullish structure. Furthermore, the short-term oscillators are conveying encouraging signals in upside momentum. The MACD, in the positive region, is growing above its red trigger line, while the RSI [..]

post-image

Technical Analysis – EURUSD plunges after cap around 1.2000; bearish pressures grow

Posted on March 18, 2021 at 2:50 pm GMT

EURUSD has nosedived below the Ichimoku cloud’s lower band at 1.1932 and is flirting now with the 50-period simple moving average (SMA) around 1.1921. The 100-period SMA, which recently curbed positive price action around 1.1990, is falling with the 200-period SMA and is together endorsing the negative picture in the pair. However, the unclear signals in directional momentum transmitted from the Ichimoku lines and the diminished downward slope of the 50-period SMA are nurturing a somewhat more sideways market. The [..]

post-image

Technical Analysis – Palladium futures exit range after eight months; eyes turn to 2020 record top

Posted on March 18, 2021 at 2:09 pm GMT

Palladium futures (June delivery) accelerated beyond the 2,530 ceiling, breaking the eight-month-old range area to hit a one-year high of 2,705. The bullish spark pushed the RSI and the Stochastics into the overbought territory, though neither of these indicators has reached a peak yet, making additional upside corrections towards the 2020 record top of 2,786 a likely scenario in the near term. The psychological mark of 2,900 could be the next spot to watch if more buyers enter the market. Should sellers [..]

post-image

Technical Analysis – NZDJPY tests 79 level, but mixed momentum clouds near-term bias

Posted on March 18, 2021 at 11:45 am GMT

NZDJPY is testing the upper Bollinger band around 79 after successfully cracking the recently formed ceiling of 78.65. Nevertheless, momentum indicators have receded slightly in recent days. The fast-moving %K line of the stochastic oscillator has slipped below the %D line, signalling some price weakness in the coming sessions. However, the fact that they haven’t managed to rise above the 80 overbought mark in the latest upswing has left the door open for another attempt to climb above it. In [..]

Technical Analysis – AUDUSD fades from 0.8000, ranges around 50-day SMA

Posted on March 18, 2021 at 10:06 am GMT

AUDUSD seems to be stuck between the directionless Ichimoku lines and is consolidating slightly above the Ichimoku cloud. The flattening 50-day simple moving average (SMA) appears to be providing some footing for buyers, while all SMAs are defending the broader bullish price structure. The Ichimoku lines and the short-term oscillators are suggesting that crucial directional momentum has subsided, however the oscillators are indicating a marginal improvement in sentiment. The MACD has ever so slightly shoved above its red trigger line [..]

Risk Warning: Your capital is at risk. Leveraged products may not be suitable for everyone. Please consider our Risk Disclosure.