XM does not provide services to residents of the United States of America.

Technical Analysis

post-image

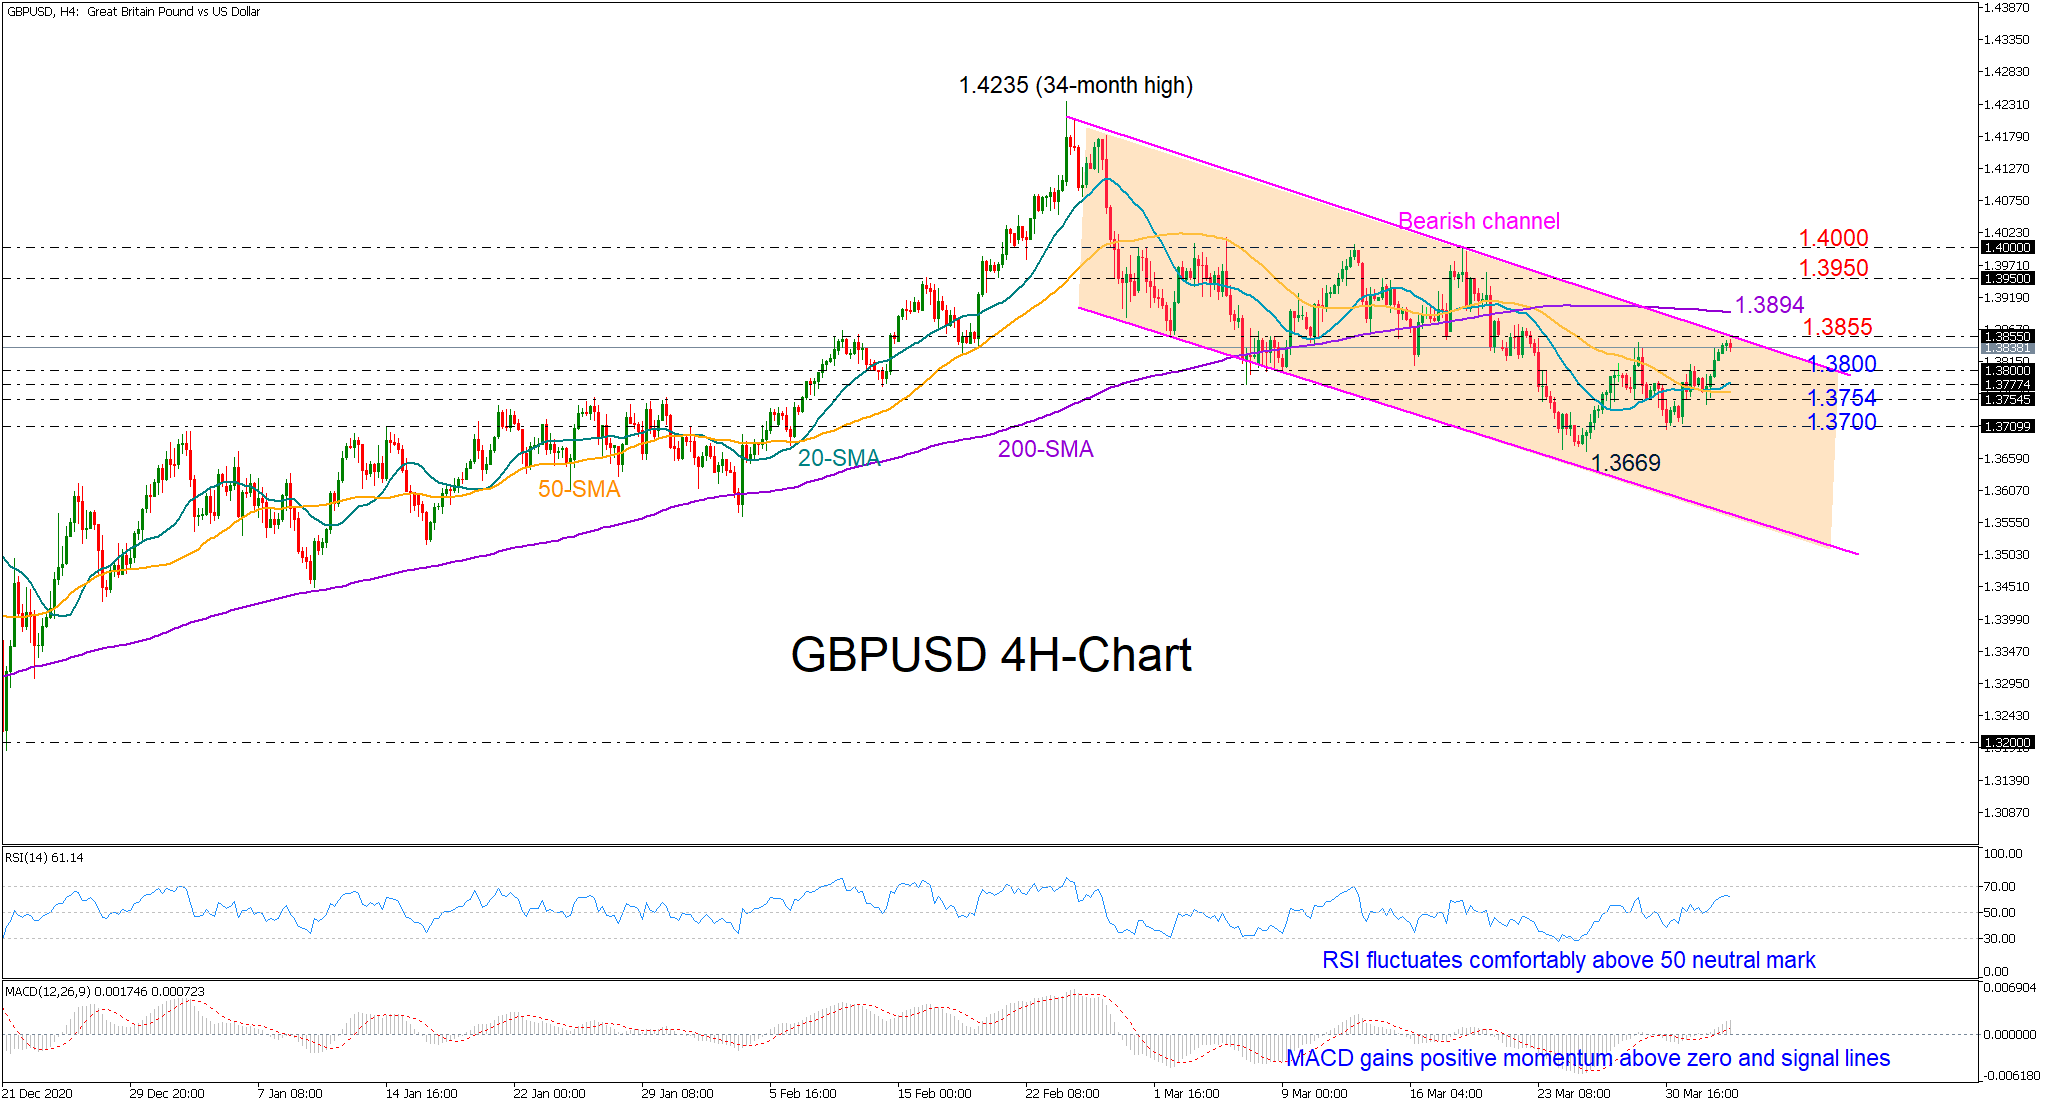
Technical Analysis – GBPUSD tests its bullish momentum near channel’s upper band

Posted on April 2, 2021 at 7:28 am GMT

GBPUSD is testing the topline of the downward-sloping channel, having registered a higher low at 1.3700, and surpassed its 20- and 50-period simple moving averages (SMAs) on the four-hour chart. The RSI and the MACD are positioned in the bullish area, promoting further improvement in the market as the former is extending its positive momentum above its 50 neutral level and the latter is gaining strength above its signal and zero lines. A decisive close above the channel and the 1.3855 level [..]

Technical Analysis – USDCAD loses steam around falling line

Posted on April 2, 2021 at 6:29 am GMT

USDCAD is touching the descending trend line after the jump above it in the previous week. The price is returning lower after the pullback off the 1.2645 resistance, remaining within the 20- and 40-day simple moving averages (SMAs). The MACD is flattening near the zero level, while the RSI is ticking slightly up near the neutral-threshold of 50. Immediate resistance could be faced near the 1.2645 barrier and the Ichimoku cloud before travelling towards the 1.2750 level. An upside move [..]

post-image

Technical Analysis – AUDUSD bears eye 0.75 level after breaking key support

Posted on April 1, 2021 at 6:03 am GMT

AUDUSD has broken below the key support level of 0.7560, which was successfully defended back in February and March, and is now plumbing fresh 3-month lows. The momentum indicators are pointing to increased bearish bias in the short term. The RSI is declining and heading towards the 30 oversold level, while the %K of the stochastic oscillator has crossed back below the %D line and both are falling. At this rate, it’s only a matter of time before the psychologically [..]

post-image

Technical Analysis – US 500 index chases fresh record highs; bullish momentum likely to slow

Posted on March 31, 2021 at 3:45 pm GMT

The US 500 stock index (cash) is seeking to resume its long-term uptrend above the previous all-time high of 3,988 after rejecting any declines inside the Ichimoku cloud and below its shorter-term simple moving averages (SMAs). The RSI is regaining strength within the bullish territory but has still some way to go to reach its 70 overbought level, while the Stochastics, although above 80, have yet to negatively intersect each other, suggesting that there is still some room for improvement in [..]

post-image

Technical Analysis – GBPJPY retreats as sellers surface at fresh highs     

Posted on March 31, 2021 at 3:29 pm GMT

GBPJPY climbed to a new 35-month high of 152.59 after finding support from the 200-period simple moving average (SMA) on the four-hour chart, which secured the positive structure. The 50-period SMA appears to be slowly reversing its negative bearing, giving credence to the positive picture. The bullish Ichimoku lines are indicating a continual growth in positive momentum, though the pair seems to be struggling to gain ground ahead of the resistance band from 152.72-152.95. The short-term oscillators are reflecting mixed [..]

post-image

Technical Analysis – Gold fails to test 9-month low; neutral bias

Posted on March 31, 2021 at 8:30 am GMT

The gold price tried to test the nine-month low of 1,676 again, but it is returning slightly higher over the last 4-hour session. In the very-short-term, the metal has been in a strongly bearish tendency after the pullback from 1,747. The momentum indicators are confirming the recent upside move, with the stochastic posting a bullish crossover in the oversold territory, within the %K and %D lines, while the RSI is heading north below the 30 level. A jump higher could [..]

Technical Analysis – NZDUSD bears relax but bearish risks linger

Posted on March 31, 2021 at 8:22 am GMT

NZDUSD’s negative impetus has abated slightly after a strong plunge and sellers seem to have taken the bench for a breather. The 200-day simple moving average (SMA) is defending the positive structure, while the dipping 50-day SMA is nearing a bearish crossover of the 100-day SMA, whose upwards trajectory is starting to wane. The diving Ichimoku lines are signalling that negative momentum is set to resume, while the short-term oscillators are reflecting a decrease in the price’s downward potency. The [..]

Technical Analysis – USDJPY flies to fresh 1-year high around 111.00

Posted on March 31, 2021 at 7:27 am GMT

USDJPY is surging towards a fresh one-year high of 110.95, continuing its positive trend after the bounce off the 108.40 support and the 20-day simple moving average (SMA). The RSI is holding in the overbought territory, while the MACD is flirting with the trigger line in the positive region. A move to the upside may meet resistance around the 112.20-112.40 resistance area ahead of the 114.20 barrier, registered in November 2018. Immediate support to potential bearish moves may by take place around the 109.90-109.35 zone. [..]

post-image

Technical Analysis – USDCAD steers above 200-MA and tackles latest highs

Posted on March 30, 2021 at 3:29 pm GMT

USDCAD has aggressively overcome the 200-period simple moving average (SMA) on the four-hour chart and positive momentum in the pair seems to be still growing, something also being reflected in the rising Ichimoku lines. The climbing 50-period SMA and its recent bullish crossover of the falling 100-period SMA is endorsing the upward move in the price. The short-term oscillators are reflecting mixed signals towards positive sentiment. The MACD, in the positive region, has nudged back above its red trigger line, [..]

post-image

Technical Analysis – WTI futures decline in a neutral phase in near term

Posted on March 30, 2021 at 12:52 pm GMT

WTI futures are posting negative days in the last three sessions, touching the 20- and 40-period simple moving averages (SMAs) in the 4-hour chart. The momentum indicators are signaling further decreases as the RSI is pointing downwards, flirting with the neutral-threshold of 50, while the MACD is losing ground in the positive region. Immediate support for the bears could be faced from the 23.6% Fibonacci retracement level of the down leg from 68.00 to 57.38 at 59.85. Underneath the latter, [..]

Risk Warning: Your capital is at risk. Leveraged products may not be suitable for everyone. Please consider our Risk Disclosure.