XM does not provide services to residents of the United States of America.

Technical Analysis

post-image

Technical Analysis – EURCHF fluctuates in neutral phase below 1.11

Posted on April 5, 2021 at 12:59 pm GMT

EURCHF has been trading in a horizontal trajectory over the last month, struggling within the short-term simple moving averages (SMAs) in the 4-hour chart. The RSI is holding marginally above the 50 level, however, the stochastic posted a bearish crossover within its %K and %D lines, suggesting a downside movement. A drop beneath the Ichimoku cloud could drive the pair towards the 1.1035 support, which overlaps with the 200-period SMA ahead of the 1.1000 psychological level. Beneath these obstacles, a downside phase [..]

post-image

Technical Analysis – AUDUSD struggles to extend bounce as bearish risks linger

Posted on April 5, 2021 at 12:37 pm GMT

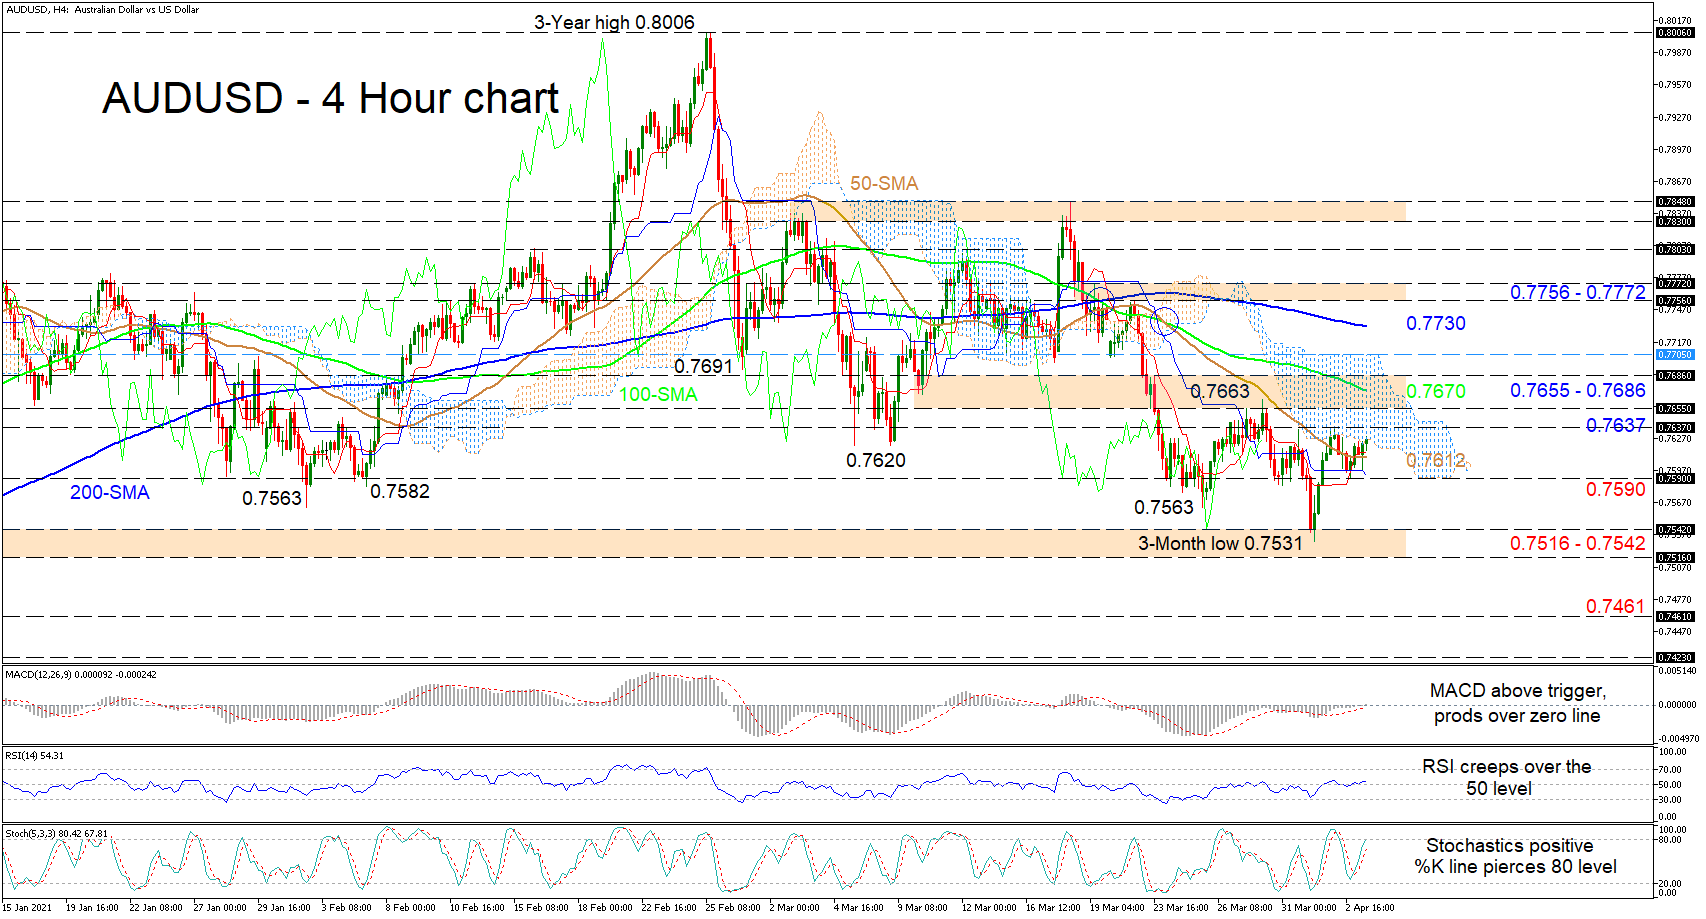
AUDUSD recently found a foothold within the 0.7516-0.7542 support foundation, although the aggressive traction off the three-month low of 0.7531 has been muted somewhat. The falling 100- and 200-period simple moving averages (SMAs) are safeguarding the bearish structure while the 50-period SMA remains incapable of disrupting it, despite its slowed downward pace. Even though the pair has edged over the 50-period SMA at 0.7612, the directionless Ichimoku lines are reflecting the absence of positive drive in the pair to clear [..]

Technical Analysis – EURUSD flickers red below 200-day SMA

Posted on April 5, 2021 at 8:51 am GMT

EURUSD’s correction below the 200-day simple moving average (SMA) is transmitting a growing bearish tone. The falling 50-day SMA appears to be heading for a bearish crossover of the 200-day SMA as well, which would further power the negative picture. The flattening blue Kijun-sen line is reflecting the minor bounce in the pair however, the Ichimoku lines are backing the price’s descent. That said, the short-term oscillators are conveying conflicting signals in directional momentum. The MACD, some distance under the [..]

post-image

Technical Analysis – US 500 index flirts with all-time high; holds above SMAs

Posted on April 5, 2021 at 8:45 am GMT

The US 500 index is holding around the fresh all-time high above the 4,000 handle, remaining well above the daily simple moving averages (SMAs) and the Ichimoku cloud. The MACD is hovering above the trigger line in the positive territory, while the RSI looks to be turning slightly lower above the neutral level of 50. If there is a move higher again, the index could flirt again with the record high of 4,047.72. A rise above this crucial line would [..]

Technical Analysis – Gold’s double bottom not enough for an outlook reversal

Posted on April 5, 2021 at 7:36 am GMT

Gold has created a potential double bottom pattern around 1,676, raising hopes that a bullish trend reversal could be in progress. Traders, however, should be cautious as the blue Kijun-sen line continues to cap upside corrections, while the RSI seems to be struggling to crawl above its 50 neutral mark despite its rebound off the oversold area. The MACD keeps hovering above its red signal line and within the negative region, backing that narrative too. A confirmation of the bullish structure could come above the 1,745 neckline, [..]

post-image

Technical Analysis – USDJPY moves horizontally below 1-year high

Posted on April 5, 2021 at 6:46 am GMT

USDJPY has been moving horizontally after the sharp rally towards the one-year high of 109.85. The price is holding around the 20-period simple moving average (SMA) and above the Ichimoku cloud. The RSI indicator is flattening in the positive region, however, the stochastic posted a bearish crossover within the %K and %D lines below the overbought zone. If the price drops lower, the next support could come from the 40-period SMA, currently at 110.20 ahead of the 109.85 barrier. More [..]

post-image

Technical Analysis – US 30 index resumes bullish bias; upside risks improve

Posted on April 2, 2021 at 1:28 pm GMT

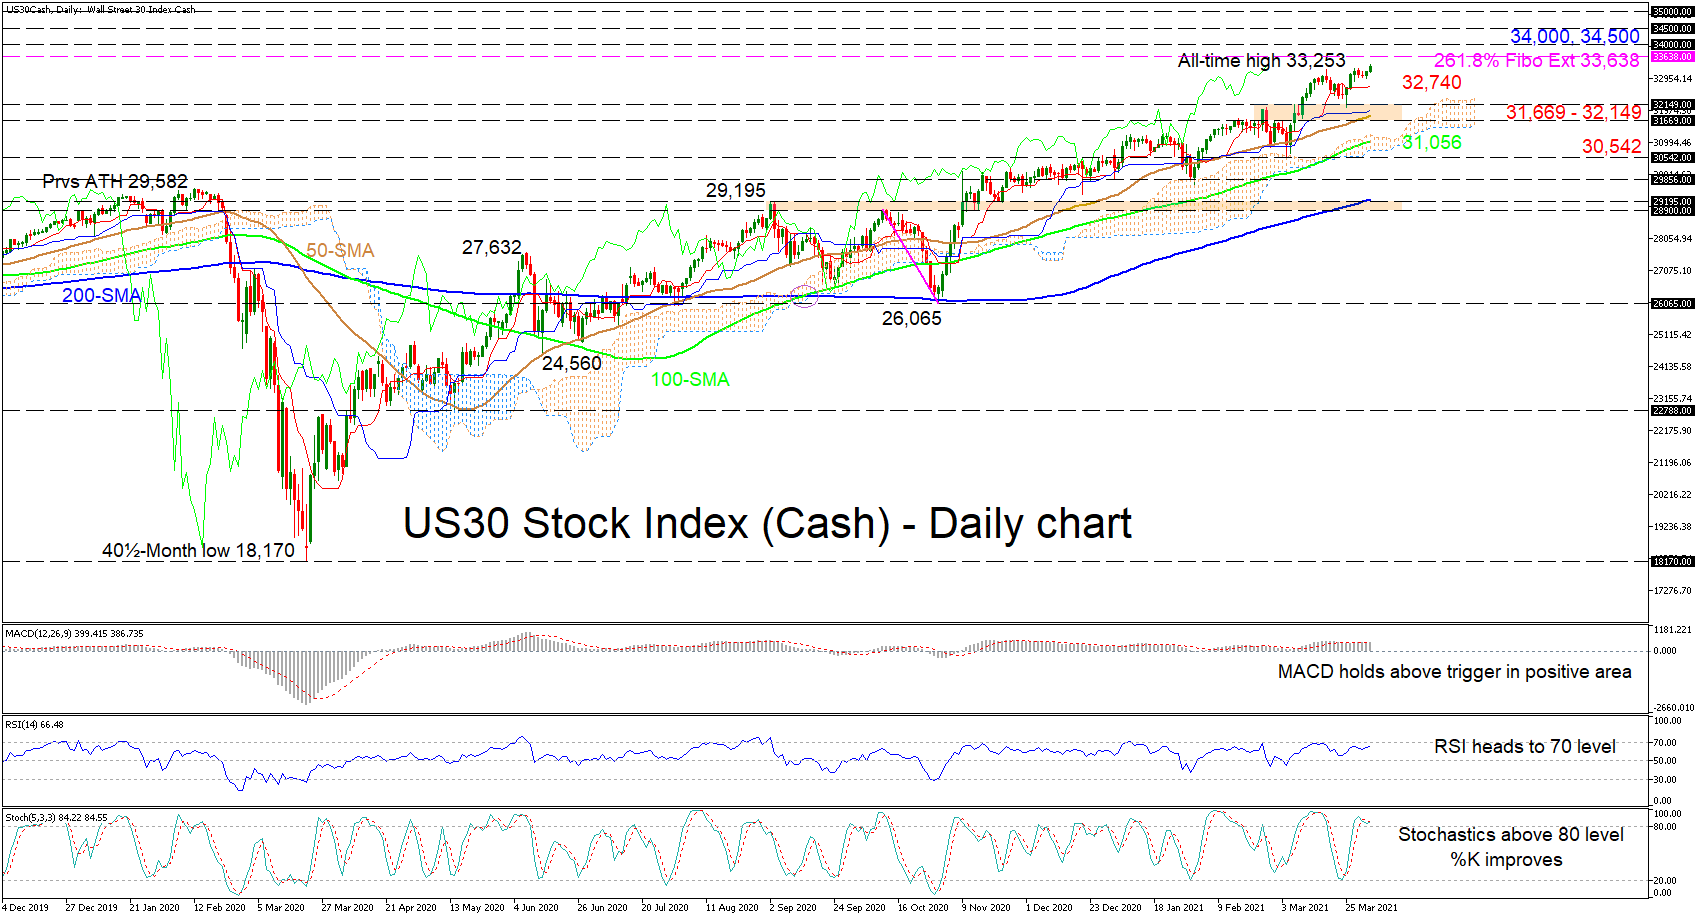
The US30 stock index (Cash) has currently crept over the all-time high of 33,253 and is headed for the 33,638 level, which happens to be the 261.8% Fibonacci extension of the down leg from 28,900 to 26,065. The sturdy advancing simple moving averages (SMA) are defending the bullish structure, while positive sentiment appears to be picking up. The Ichimoku lines are conveying the above mentioned view point – as are the short-term oscillators – and are starting to turn upwards [..]

post-image

Technical Analysis – USDCHF jittery ahead of long-term restrictive line

Posted on April 2, 2021 at 12:29 pm GMT

USDCHF’s attempts to navigate towards the looming long-term restrictive trend line may not be in vain, even though its positive spark seems to be fading. As mentioned, the bullish impetus appears to be withering from its fresh nine-month high of 0.9472, however, the Ichimoku lines are suggesting that the upward pattern’s sentiment remains intact. Adding credence to the upside is the advancing slopes of the 50- and 100-day simple moving averages (SMAs) and the recent bullish crossover from the 50-day [..]

post-image

Technical Analysis – EURUSD trapped in a range; key obstacles remain ahead

Posted on April 2, 2021 at 12:10 pm GMT

EURUSD is in a tight range between the 23.6% Fibonacci retracement of the 1.1988 – 1.1703 downfall and the 50-period simple moving average (SMA) on the four-hour chart for the second consecutive day. The momentum indicators provide a mixture of signals. The MACD prepares to enter the positive area and the RSI, although a bit weaker remains above its 50 neutral mark, both keeping the short-term risk tilted to the upside. On the other hand, the green %K line of [..]

Technical Analysis – GBPJPY’s opposing forces fail to oust bullish tone

Posted on April 2, 2021 at 8:53 am GMT

GBPJPY is sustaining its upward trajectory reaching a 35½-month high of 153.20, and bearish powers seem to be incapable of overthrowing the uptrend. The soaring simple moving averages (SMA) are safeguarding the positive structure, while the rising Ichimoku lines are indicating a rekindling in positive momentum. The short-term oscillators are reflecting the pause in the pair’s climb but are favouring the improving picture. The MACD, north of the zero mark, has returned back above its red trigger line, while the [..]

Risk Warning: Your capital is at risk. Leveraged products may not be suitable for everyone. Please consider our Risk Disclosure.