XM does not provide services to residents of the United States of America.

Technical Analysis

post-image

Technical Analysis – GER 30 index set for a bearish correction after new record high

Posted on April 7, 2021 at 2:59 pm GMT

The German 30 index (cash) posted its first red candle after its seven-day-old bullish streak halted at a new record high of 15,364 on Tuesday. The RSI and the Stochastics seem to have peaked within the overbought area too, justifying the recent pullback in the price. Despite that, the upward-sloping simple moving averages (SMAs) and the trading above the Ichimoku cloud keep embracing the broader positive trajectory in the market – of course as long as the price continues to [..]

post-image

Technical Analysis – EURGBP climbs above 0.8600, breaking descending channel

Posted on April 7, 2021 at 1:13 pm GMT

EURGBP is ticking considerably higher above 0.8600, surpassing the medium-term falling channel and the 20- and 40-day simple moving averages (SMAs). The RSI is jumping above the neutral-threshold of 50, while the stochastic is approaching the overbought area, suggesting an overstretched market in the short-term. Steeper increases could send the market until the 0.8730-0.8790 resistance area before rising towards the 200-day SMA, currently at 0.8920. Marginally above this zone lies the 0.8946 barrier, taken from the inside swing low from [..]

Technical Analysis – NZDUSD sets a foothold to fight key resistance

Posted on April 7, 2021 at 9:25 am GMT

NZDUSD pushed above the four-month low of 0.6942 to test the 20-day simple moving average (SMA), which has been capping bullish actions since the start of March. The line, which is currently hovering around 0.7074, is a hurdle for the third consecutive day, and the slowing pace in the RSI, as well as the easing momentum in the Stochastics, are providing little optimism for another bullish extension. Nevertheless, as long as the red Tenkan-Sen and the 50% Fibonacci retracement of the [..]

post-image

Technical Analysis – Gold falls near 100-period SMA in neutral mode

Posted on April 7, 2021 at 8:54 am GMT

The gold price has reversed back down again after finding resistance around the 1,747 mark, holding marginally above the 100-period simple moving average (SMA). The price has been moving within a consolidation area with the 1,755 barrier as upper boundary and the 1,676 support as lower boundary; a range that has held since February 26. Momentum indicators are pointing to a negative bias in the short term with the RSI just below 70 and the stochastic oscillator easing from bullish territory and it has posted a bearish cross within the [..]

Technical Analysis – USDJPY’s bullish pattern stands tall despite retraction

Posted on April 7, 2021 at 8:17 am GMT

USDJPY buyers have emerged within the 109.66-109.84 zone (previous resistance-now-support) to contest the price pullback off a 1-year high of 110.96. The soaring 50- and 100-day simple moving averages (SMAs) are defending the near three-month rally off the 102.58 level, while a near completion of a bullish crossover of the 200-day SMA could further boost this outlook. The advancing Ichimoku lines suggest that positive sentiment remains potent, opposing the minor price correction, while the short-term oscillators are reflecting mixed signals [..]

post-image

Technical Analysis – Silver’s positive impetus looks feeble as bearish risks dictate

Posted on April 6, 2021 at 2:25 pm GMT

Silver is creeping higher to retest the durable tentative down trend line pulled from a near 8-year high of 30.08. However, today’s footing off the flattening 50-period simple moving average (SMA) appears somewhat not up to the task at hand, as lingering above are the commanding bearish 100- and 200-period SMAs. The short-term oscillators suggest the commodity is struggling to improve, but positive momentum seems to be growing. The MACD is slightly beyond the zero line and slowly increasing over [..]

post-image

Technical Analysis – USDCAD retains bearish phase above 1.2500

Posted on April 6, 2021 at 9:32 am GMT

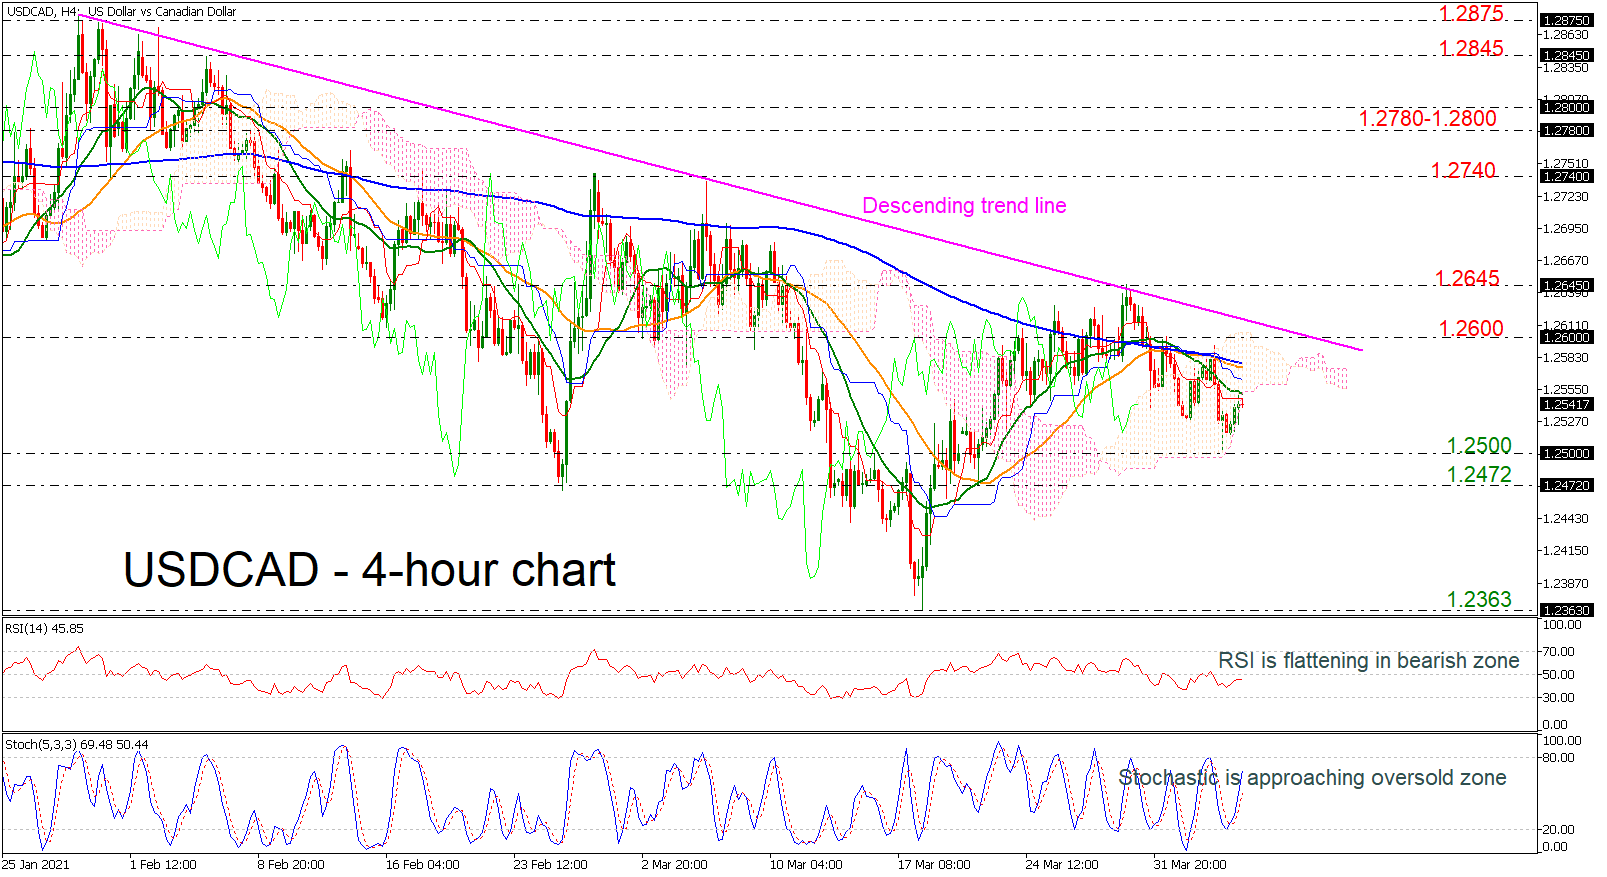
USDCAD is declining below the descending trend line and the simple moving averages (SMAs) after the pullback off 1.2645, however, the technical indicators are showing mixed signals. The RSI flattening in the negative territory, while the stochastic rebounded off the oversold zone, posting a bullish cross within the 20- and 40-period SMAs. A leg lower could meet the 1.2472 – 1.2500 support zone before taking the bears even lower towards the 1.2363 level, achieved in March 18. On the flip [..]

Technical Analysis – EURJPY puzzled near March highs, but still supported

Posted on April 6, 2021 at 7:13 am GMT

EURJPY is sustaining its upward trajectory above the ascending trendline, currently flirting with the March peaks and the 61.8% Fibonacci retracement of the 2018 – 2020 sell-off around 130.15. The technical indicators provide a mixture of signals. The Stochastics’ intersection within the overbought area and the bearish cross between the red Tenkan-sen and blue Kijun-sen lines is a negative warning that the bulls are losing energy. On the other hand, the RSI continues to move towards its 70 overbought mark, while the price itself has yet [..]

Technical Analysis – GBPUSD eases slightly after bullish action in near term

Posted on April 6, 2021 at 7:06 am GMT

GBPUSD is slowing its momentum after the rise in the Ichimoku cloud, finding crucial support at 1.3670. Also, cable is hovering beneath the bearish crossover within the 20- and 40-day simple moving averages (SMAs). The technical indicators are showing positive signals. The RSI is pointing up in the positive area, while the stochastic is entering the overbought region. A clear step above the short-term SMAs could take the investors until the 1.4000 handle before touching the mutli-month peak of 1.4235 and [..]

post-image

Technical Analysis – WTI futures range-bound but bearish tone threatens outlook

Posted on April 5, 2021 at 3:33 pm GMT

WTI oil futures are currently tackling the direct support zone of 58.86-59.58 on the four-hour chart, although remain within a ranging market between the confines of 57.25 and 62.24. The 50-period simple moving average’s (SMA) bearish incline has waned slightly and is promoting the sideways market, while the falling 100-period SMA, which has recently completed a bearish crossover of the 200-period SMA, is feeding the negative picture. The Ichimoku lines are demonstrating a lack of directional impetus, backing the neutral [..]

Risk Warning: Your capital is at risk. Leveraged products may not be suitable for everyone. Please consider our Risk Disclosure.