XM does not provide services to residents of the United States of America.

Technical Analysis

post-image

Technical Analysis – GBPUSD plunges below 1.37; bearish bias back on cards

Posted on April 9, 2021 at 7:21 am GMT

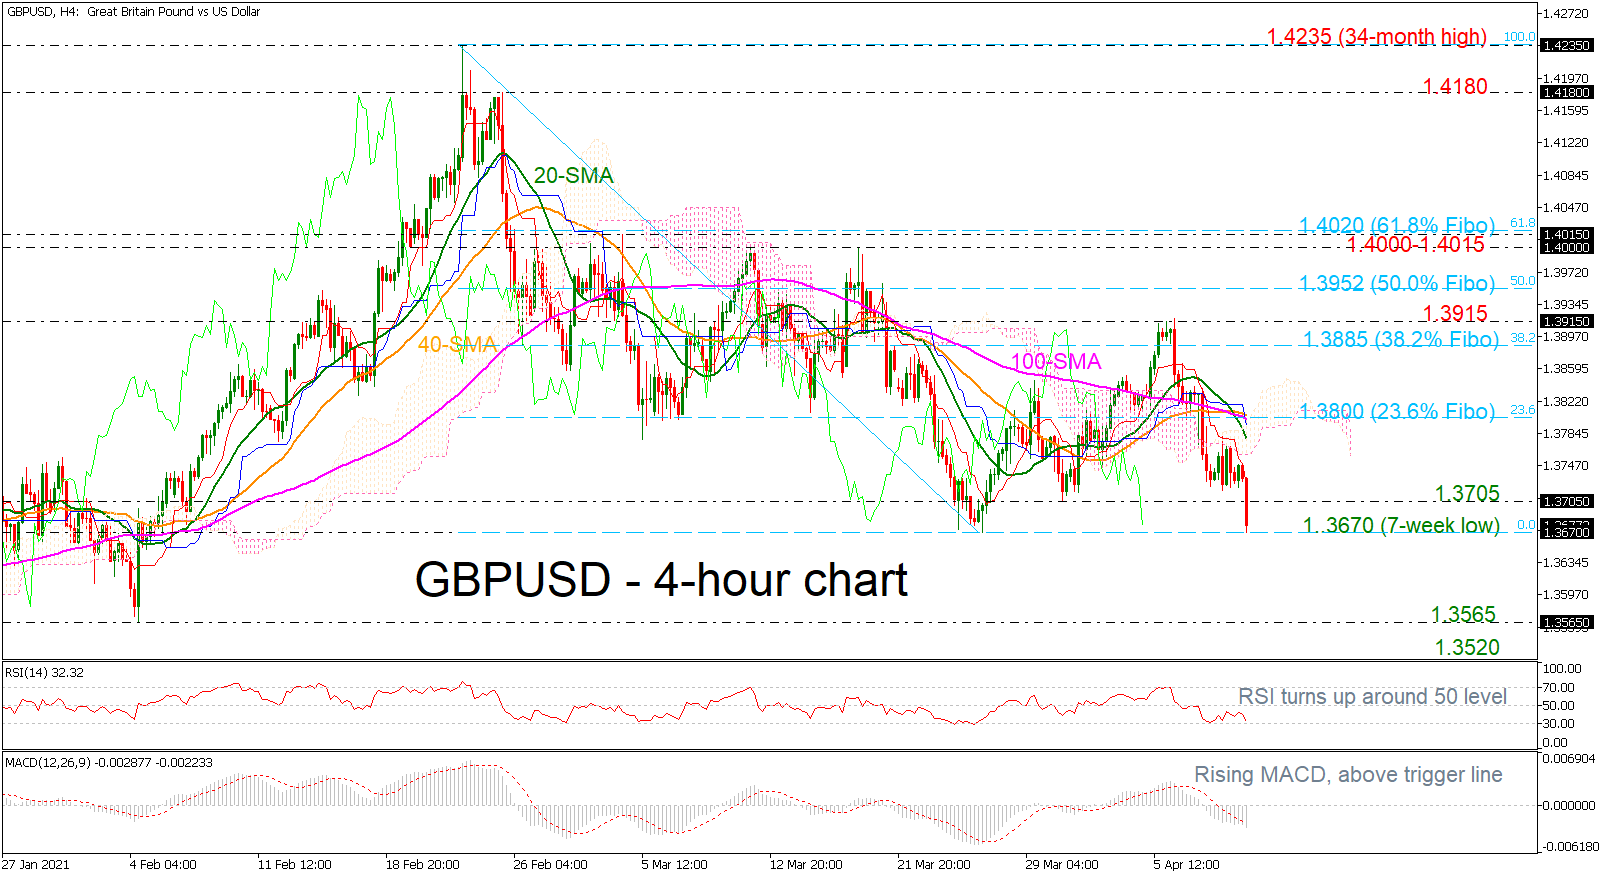
GBPUSD is plummeting beneath the 1.3700 round number and it touched again the seven-week low of 1.3670 today. The short-term moving averages are pointing all down suggesting more losses, while the technical indicators are extending its bearish movement.  The RSI is sloping down in the negative territory, while the MACD is stretching below its trigger and zero lines. More downside movements could meet the 1.3565 support level, taken from the trough on February 4. Below that, the 1.3520 barrier, registered [..]
Technical Analysis – GBPJPY eyes nearby key support as negative risks dominate

Posted on April 9, 2021 at 7:05 am GMT

GBPJPY proved once again unable to pierce the long-term resistance line despite its quick rally, topping instead at 153.39 before plunging back below the 150.00 level. Downside risks keep lingering in the background according to the RSI and the Stochastics, as the former has slipped below its 50 neutral mark and the latter has yet to post a bullish cross below its 80 oversold level. Yet, a bounce higher cannot be ruled out in the short term, as the price [..]

post-image

Technical Analysis – US 30 index takes a breather around 123.6% Fibonacci extension

Posted on April 8, 2021 at 3:44 pm GMT

The US 30 stock index (Cash) is currently edging sideways around the mostly neutral red Tenkan-sen line however, the bullish bias remains potent. The climbing simple moving averages (SMAs) are safeguarding the bigger bullish structure, while the relatively stable Ichimoku lines are reflecting a period of paused directional drive. The short-term oscillators are transmitting signals of waning positive momentum; however this is not sufficient to suggest a more aggressive pullback in the price. The MACD is still in the bullish [..]

post-image

Technical Analysis – WTI futures creep sideways but possess upside potential

Posted on April 8, 2021 at 1:36 pm GMT

WTI oil futures have moulded a strong base from 57.25 to 58.10 and are consolidating around the 60.06 mark, which happens to be the 23.6% Fibonacci retracement of the up leg from 34.02 until 67.96. The commodity’s price action is currently confined between the 57.25 and 63.13 limits. However, the advancing simple moving averages (SMAs) are nourishing the broader bullish structure, while the Ichimoku lines are suggesting an evaporation of directional impetus. The short-term oscillators are demonstrating an environment of [..]

post-image

Technical Analysis – CADJPY posts red days; broader outlook is bullish

Posted on April 8, 2021 at 12:08 pm GMT

CADJPY has come under renewed selling pressure, falling back below its 20-day simple moving average (SMA). Despite the latest pullback though, the pair has not posted a fresh lower low, which makes one hesitant to trust further declines for now. Looking at momentum oscillators on the daily chart though, they suggest further declines may be on the cards in the short-term. The RSI is approaching its neutral 50 line, detecting negative momentum, and is also pointing downwards. The MACD, already [..]

Technical Analysis – AUDUSD sticks about 0.7600 mark; retains optimism

Posted on April 8, 2021 at 8:55 am GMT

AUDUSD is edging sideways in the vicinity of the 100-day simple moving average (SMA), sustaining its persevering bullish twinkle.  All the SMAs are defending the stubborn bullish structure, in spite of the fairly horizontal demeanour of the 50-day SMA. The flattening Ichimoku lines suggest that the bearish impetus has fairly subsided, while the short-term oscillators are transmitting conflicting signals in directional momentum. The MACD has marginally stepped above its red trigger line but remains just below the zero level, while [..]

post-image

Technical Analysis – EURJPY drops to around 130.00 in bullish outlook

Posted on April 8, 2021 at 8:49 am GMT

EURJPY is plunging from the 30-month high of 130.67, diving below the 23.6% Fibonacci retracement level of the upward wave from 128.28 to 130.67 at 130.09 and the short-term moving averages. The RSI indicator is falling from the 50 level, while the MACD oscillator is holding below the trigger line, both confirming the recent bearish structure. In the event of more negative pressures, the market could meet support at the 38.2% Fibonacci of 129.75 before it heads lower to the [..]

post-image

Technical Analysis – EURUSD moves up around 1.19 in near term

Posted on April 8, 2021 at 8:07 am GMT

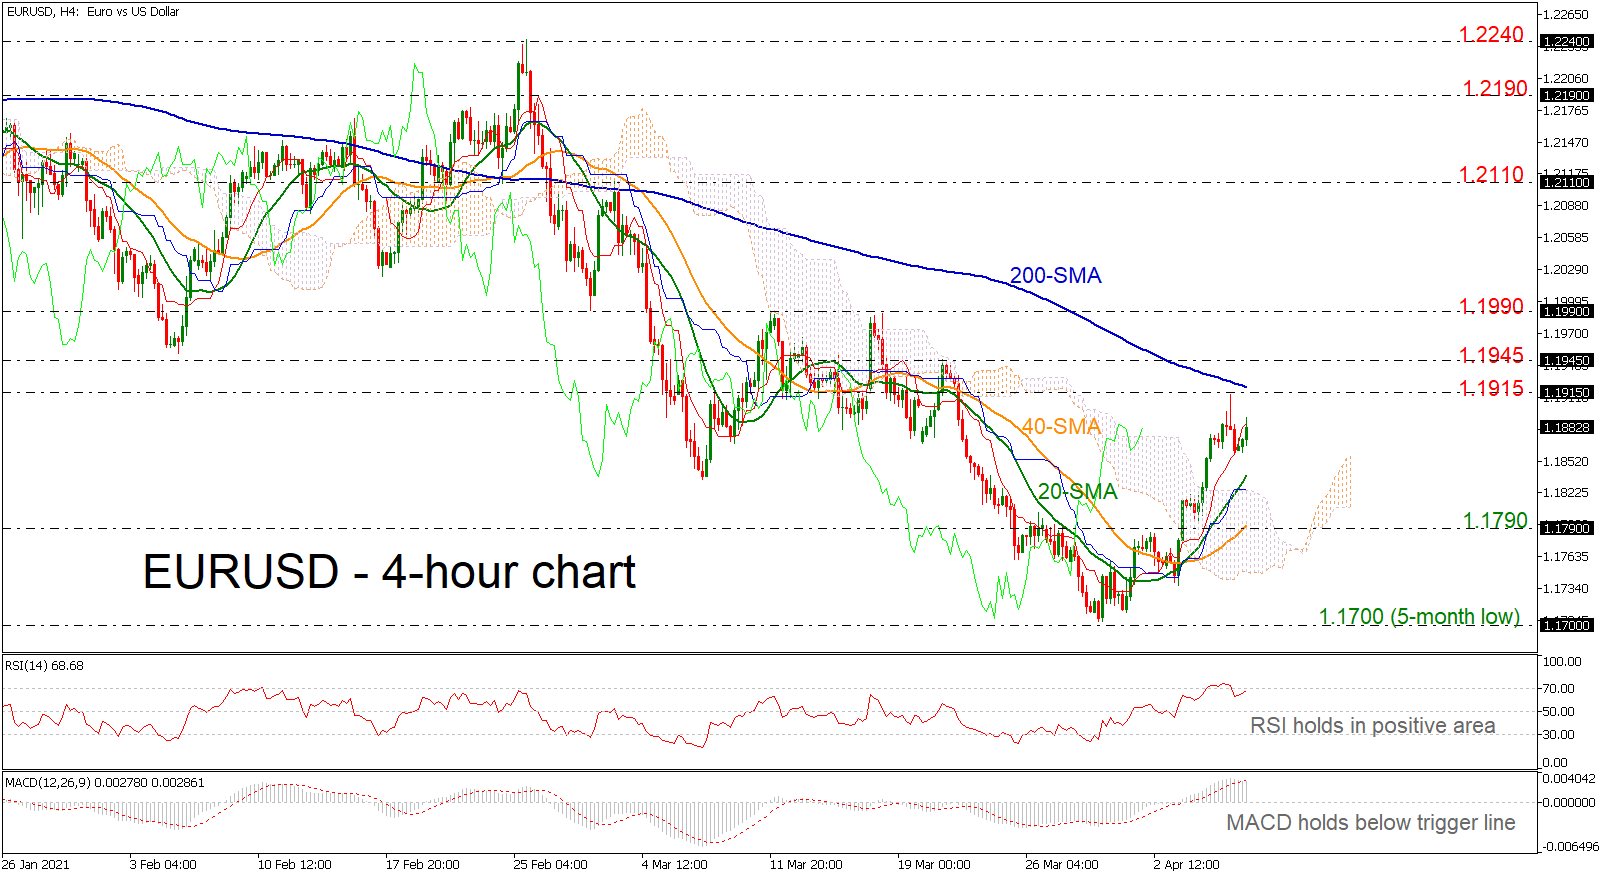
EURUSD eased below the 1.1900 psychological level again, finding resistance at 1.1915 and the 200-period simple moving average (SMA). However, the rebound off the five-month low of 1.1700 is still in place, pushing the price well above the short-term SMAs. From a technical perspective, the RSI indicator is showing some positive signals and is approaching the overbought territory, though the MACD is holding below its trigger line in the bullish area. More advances could take the pair towards the 1.1915 barrier, which [..]

Technical Analysis – USDCHF breaks 6-week bullish streak; medium-term uptrend intact

Posted on April 8, 2021 at 7:24 am GMT

USDCHF came under significant downside pressure this week, quickly trimming its six-week bullish streak and diving back below the 0.9300 level. Although the pair has dipped below the supportive 20-day simple moving average (SMA), the medium-term market structure remains skewed to the upside, with the golden cross between the 50- and 200-day SMA promoting the recovery. Turning to the short-term picture, the pair is in a sideways move, but the momentum indicators seem to be leaning to the bearish side [..]

post-image

Technical Analysis – GBPJPY tiptoes on 200-MA; suppresses downside correction  

Posted on April 8, 2021 at 6:17 am GMT

GBPJPY’s positive structure remains intact as the pair’s pullback from the 35½-month high of 153.40 found a foothold on the 200-period simple moving average (SMA) around 150.64. The 50- and 100-period SMAs have been broken to the downside and their positive bearing has waned slightly. The downward slope in the red Tenkan-sen line is feeding negative momentum, while the flattening blue Kijun-sen line is indicating some fading in the bearish impetus. Furthermore, the short-term oscillators are conveying conflicting signals in [..]

Risk Warning: Your capital is at risk. Leveraged products may not be suitable for everyone. Please consider our Risk Disclosure.