XM does not provide services to residents of the United States of America.

Technical Analysis

Technical Analysis – GBPUSD calls for a bullish reversal near 1.3670 support

Posted on April 13, 2021 at 7:35 am GMT

GBPUSD could be due for an upside correction following the stabilization near the key 1.3670 support region. Even though the new bearish cross between the 20- and 50-day simple moving averages (SMAs), which is the first since September, suggests the continuation of the short-term downtrend, the RSI is regaining ground towards its 50 neutral level. Meanwhile, the Stochastics have already set up a bullish cross below the 20 oversold mark, signaling a pickup in positive momentum. The 1.3755 – 1.3777 [..]

Technical Analysis – EURJPY struggles near 29-month high

Posted on April 13, 2021 at 6:52 am GMT

EURJPY is sustaining its upward trajectory above the ascending trendline, currently flirting with the 29-month high of 130.65. The technical indicators provide a mixture of signals. The RSI continues to move towards its 70 overbought mark, while the price itself has yet to reach the upper Bollinger band, suggesting that there is more room for improvement. The MACD is trying to extend its move above its trigger and zero lines. Given the indecisive mode, traders may remain patient until the pair clearly closes [..]

post-image

Technical Analysis – AUDUSD edges sideways but remains negatively skewed

Posted on April 12, 2021 at 3:48 pm GMT

AUDUSD’s positive efforts are currently being capped by the 100-period simple moving average (SMA) and the pair appears to be ranging above the 0.7600 handle. The falling 100- and 200-period SMAs are promoting a bearish tone, while the somewhat frozen Ichimoku lines and the flattening 50-period SMA are reflecting the evaporation of directional sentiment. The short-term oscillators point to weakened positive impetus and are suggesting mixed signals in momentum. The MACD is hovering ever so slightly below its red trigger [..]

post-image

Technical Analysis – USDJPY eyes 109.00 handle and negative pressures lose power   

Posted on April 12, 2021 at 2:24 pm GMT

USDJPY’s recent pullback from the one-year high of 110.96 does not seem to have the necessary potency to successfully overpower the positive bias. The advancing 100- and 200-period simple moving averages (SMAs) are defending the positive structure, while the declining 50-period SMA is endorsing further price deterioration in the pair. The Ichimoku lines are reflecting neutral impetus and the short-term oscillators are transmitting conflicting signals in directional momentum. The MACD is currently above its red trigger line in the bearish [..]

Technical Analysis – EURUSD bulls run out of steam near 1.1900; trend bearish

Posted on April 12, 2021 at 11:03 am GMT

EURUSD is struggling to set a foothold above the 200-day simple moving average (SMA) despite inching above that line to reach an almost three-week high of 1.1926 last week. The 38.2% Fibonacci retracement of the 1.2242 – 1.1703 down leg seems to be another struggle in the neighborhood, preventing any close above the 1.1900 level. The technical indicators keep reflecting some caution in the market as the RSI is striving to extend beyond the 50 neutral mark and the Stochastics [..]

post-image

Technical Analysis – US 500 index’s negative pressures threaten latest rally

Posted on April 12, 2021 at 8:23 am GMT

The US 500 stock index (Cash) has been improving steadily lately, although it appears the progress in the price may suffer a minor setback as increasing bearish forces are contesting the uptrend. The positive bias is being endorsed by the rising simple moving averages (SMAs), however, the short-term oscillators are promoting a slightly different picture. Currently, the oscillators are demonstrating that positive momentum is slightly waning, validating the marginal pullback in the price. The MACD is far above the zero [..]

Technical Analysis – Gold takes a breath around SMAs; still bearish in long term

Posted on April 12, 2021 at 6:39 am GMT

The gold price has been trading within a downward sloping channel over the last eight months, after the market reached the record high of 2,074.89. Currently, the rebound off the 1,676 support is helping the yellow metal to hold within the channel and around the short-term moving averages. From the technical perspective, the stochastic is heading south, following the bearish cross within the %K and %D lines, while the RSI is pointing down near the neutral threshold of 50. In [..]

post-image

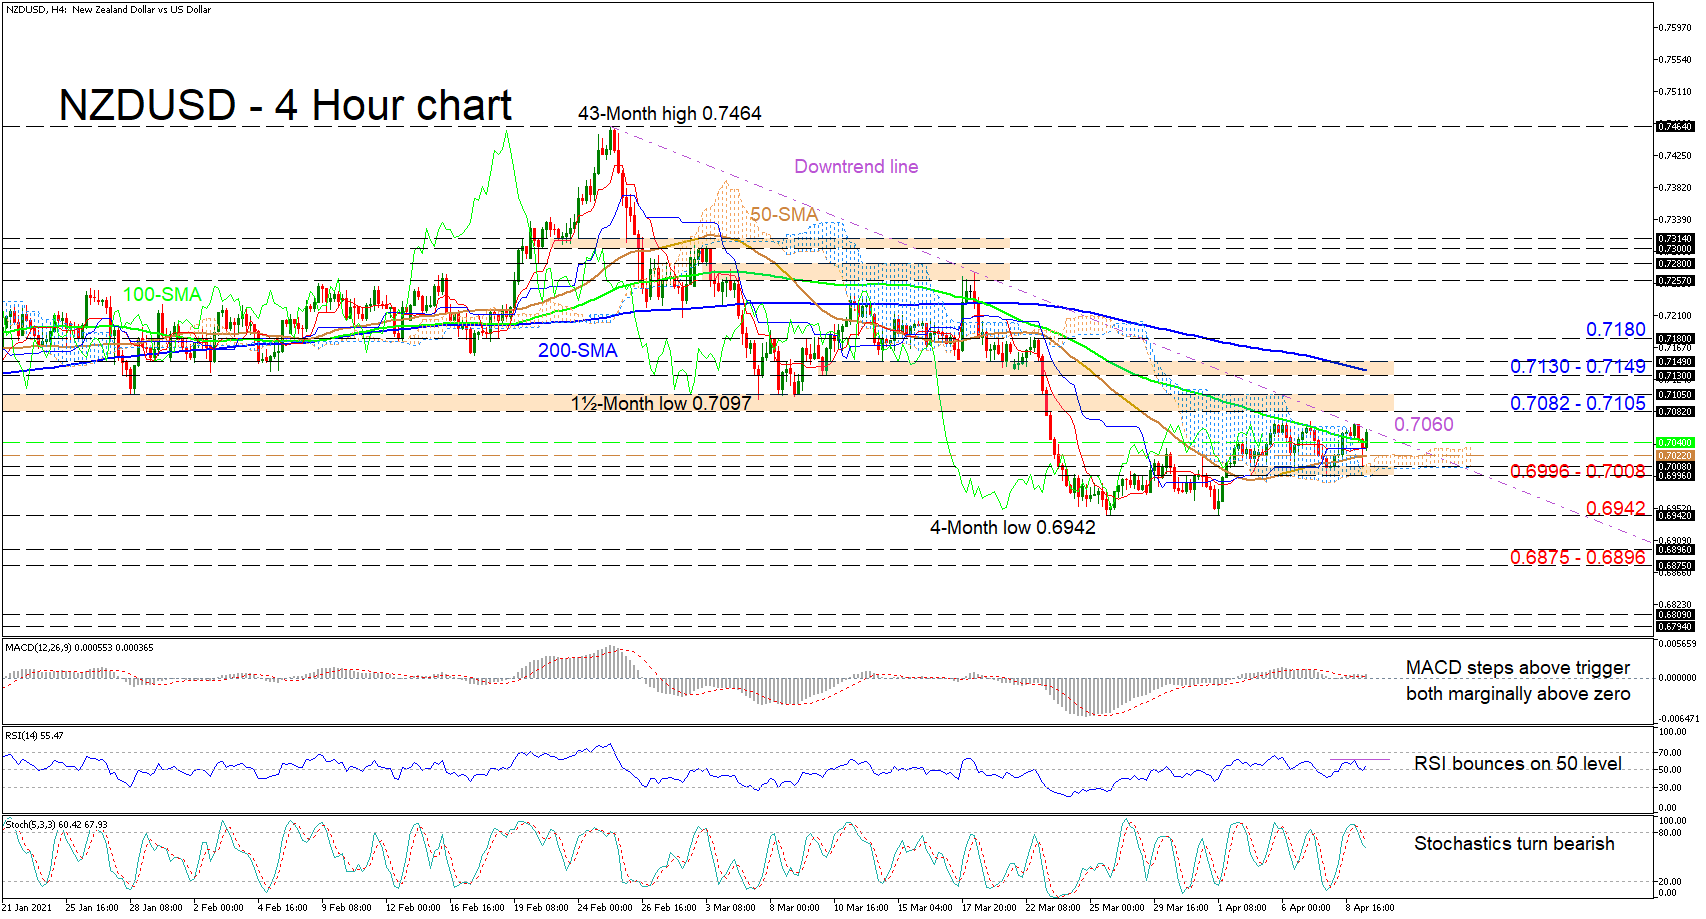
Technical Analysis – NZDUSD buyers confront short-term downtrend line

Posted on April 9, 2021 at 1:16 pm GMT

NZDUSD has consolidated over the somewhat neutral Ichimoku cloud, after slightly improving from a recently formed floor at the 0.6942 level. The falling 200- and 100-period simple moving averages (SMAs) are shielding the bearish structure, while the climbing 50-period SMA is providing a footing for the price to recoup some lost ground. Momentum seems to have evaporated and the merged and flattening Ichimoku lines are not transmitting any directional price preference. However, the short-term oscillators are relaying a mixed view [..]

post-image

Technical Analysis – US 100 index stabilizes marginally below record high

Posted on April 9, 2021 at 8:38 am GMT

The US 100 index is stabilizing around the record high of 13,904, pausing the strong upside tendency. The technical indicators, though, are sending mixed signals, suggesting that the softness in the market may not over yet. The RSI has turned lower near overbought levels, slightly below 70 indicating that the market could weaken a little bit in the short-term until the index falls below the 50 threshold. The MACD oscillator is gaining momentum above its trigger and zero lines. Should [..]

Technical Analysis – USDCAD’s positive impetus curbed by 50-day SMA and cloud

Posted on April 9, 2021 at 8:15 am GMT

USDCAD is struggling to tick higher after its recent positive propulsion off the 37½-month low of 1.2365. The descending simple moving averages (SMAs) are imposing the predominant bearish bias. Additionally, the fairly neutral demeanour of the Ichimoku lines is suggesting a phase where positive sentiment has become subdued, further tilting the scale in favour of the downside. Clearly positive momentum has significantly faded and this is being conveyed in the short-term oscillators as well. The MACD and the red trigger [..]

Risk Warning: Your capital is at risk. Leveraged products may not be suitable for everyone. Please consider our Risk Disclosure.