XM does not provide services to residents of the United States of America.

Technical Analysis

Technical Analysis – WTI futures surpass Ichimoku cloud and 62.60 level

Posted on April 15, 2021 at 6:25 am GMT

WTI crude oil futures are increasing their positive bias after several days of flat periods, remaining above the long-term ascending trend line. The price is trying to exit from the Ichimoku cloud moving towards the next resistance of the two-and-a-half-year high of 67.96. If traders continue to buy the commodity, the price could hit the 75.24 inside swing high from July 2018 ahead of the 76.87 hurdle, being the top of September 2018. Having a look at the technical indicators, [..]

post-image

Technical Analysis – Tesla bulls speed up towards January’s blocks

Posted on April 14, 2021 at 3:20 pm GMT

Tesla’s stock has finally claimed the tough resistance of 720.00 but another hurdle popped up around the 777.00 level on Wednesday. The area coincides with January’s swing low and the 23.6% Fibonacci retracement of the 432.83 – 899.98 rally; therefore it could be a tough obstacle to overcome. Nevertheless, neither the RSI nor the Stochastics have confirmed overbought conditions, and with the price having jumped above the Ichimoku cloud, the bulls may not easily abandon the game. If they successfully drive above 777.00, [..]

post-image

Technical Analysis – GBPJPY eases below bearish SMAs cross

Posted on April 14, 2021 at 2:07 pm GMT

GBPJPY has been trending to the downside over the last week after the pullback off the three-year high of 153.40. In trend indicators, the 40-period simple moving average (SMA) posted a bearish crossover with the 200-period SMA, suggesting additional negative extensions. The RSI is sloping southwards in the negative zone, however; the MACD is holding above its trigger line, reflecting some upside pressures in the market. If the 149.57 support collapses, the bears may next target the 148.51 barrier, taken from the lows on March 24. More losses from here could drive [..]

post-image

Technical Analysis – Gold snags necessary footing for retest of range’s ceiling

Posted on April 14, 2021 at 2:03 pm GMT

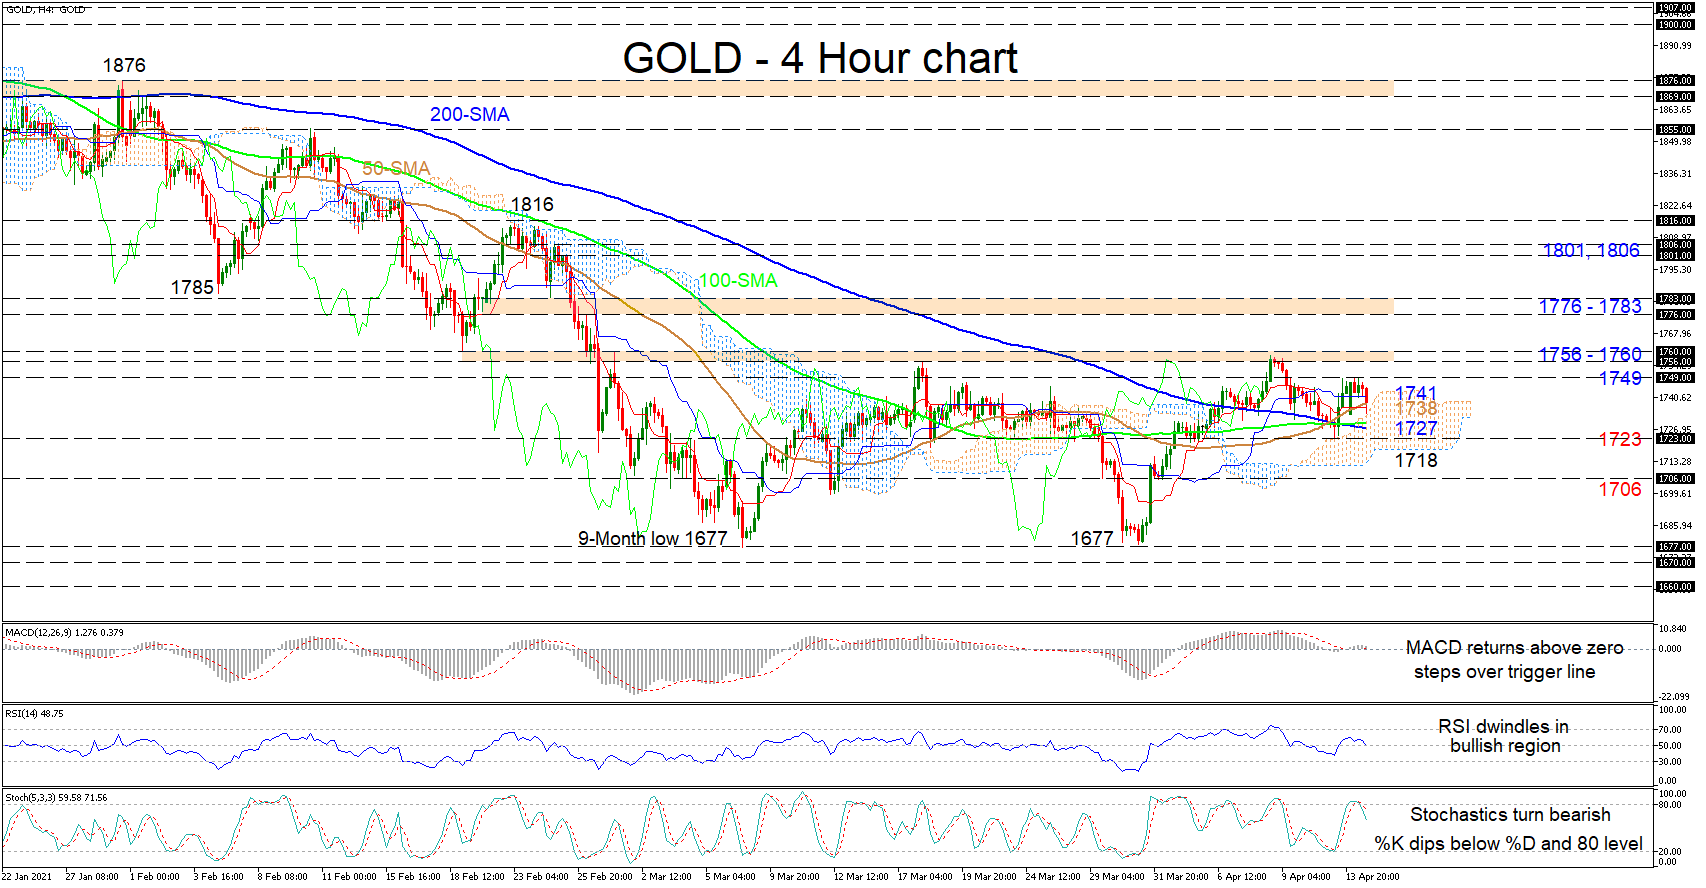
Gold recently established some positive traction off the converged simple moving averages (SMAs) and the Ichimoku cloud’s upper surface, after failing to previously clear the resistance band of 1,756-1,760. Currently the SMAs do not confirm a commanding price direction, however, the rising 50-period SMA is aiding the latest positive sentiment in the commodity. Likewise the Ichimoku lines are unclear of price direction and are demonstrating a state of evaporated directional impetus. Nonetheless, the oscillators are conveying mixed signals in short-term [..]

post-image

Technical Analysis – EURGBP sellers attempt to dominate latest rally

Posted on April 14, 2021 at 9:53 am GMT

EURGBP spiked just shy of the resistance section of 0.8713-0.8742, struggling also to defeat the 0.8700 handle as sellers coerced the pair lower. The demeanours of the simple moving averages (SMAs) are shielding the positive structure and the forthcoming bullish crossover between the 200- and 100-period SMAs could bolster this outlook. The flattening Ichimoku lines are indicating a loss of bullish momentum, while the short-term oscillators point to weakened positive impetus, and are suggesting a slight price pullback. The MACD, [..]

Technical Analysis – USDJPY enters bearish zone after support line cracks

Posted on April 14, 2021 at 9:24 am GMT

USDJPY bears managed to fracture the floor around the surface of the broken bullish channel after a three-day battle, pressing the price to a three-week low of 108.74 on Wednesday. The bearish violation raised the odds for additional downside corrections, with the momentum indicators leaning to the negative side too as the RSI is ready to cross below its 50 neutral level, the MACD keeps decelerating below its red signal line, and the Stochastics seem unable to exit the oversold [..]

Technical Analysis – NZDUSD retests 0.7100 in a downside correction

Posted on April 14, 2021 at 7:02 am GMT

NZDUSD has been in a downside correction since the pullback from the three-and-a-half-year high of 0.7463, holding within the 20- and 40-day simple moving averages (SMAs). Looking at the technical indicators, the RSI is pointing slightly higher in the negative zone, while the MACD is holding above its trigger line in the bearish territory. That said, the stochastic is heading north again after it posted a bullish crossover within the %K and %D lines. Should the market extend losses, support [..]

post-image

Technical Analysis – WTI futures push higher within a ranging market

Posted on April 13, 2021 at 3:19 pm GMT

WTI oil futures have nudged back above the 60.00 mark, overstepping the Ichimoku cloud and the 100-period simple moving average (SMA) on the four-hour chart at 60.03. The commodity’s price action remains confined between the limits of 57.25 and 62.24. The bearish demeanour within the 100- and 50-period SMAs seems to have subsided considerably, and they are now promoting a more neutral price picture. The static Ichimoku lines are not conveying any clear directional momentum in the commodity, while the [..]

post-image

Technical Analysis – USDCAD surges above 1.2600 in a neutral phase

Posted on April 13, 2021 at 12:33 pm GMT

USDCAD is heading aggressively higher above the short- and long-term simple moving averages (SMAs), surpassing the 1.2600 handle, though the neutral bias is still in place. From the technical viewpoint, the RSI is confirming this bias as it is pointing upwards, approaching the 70 level, while the stochastic is travelling in the overbought territory. If the buying interest continues and the price jumps above the 1.2635-1.2645 significant resistance area, the 1.2700 psychological level could come next before flirting with the 1.2740 barrier, registered on March 5. Alternatively, [..]

post-image

Technical Analysis – EURCHF bulls look to overturn pullback below 1.1000

Posted on April 13, 2021 at 8:09 am GMT

EURCHF has retreated to the vicinity of the 50-day simple moving average (SMA) after fading under the formed support around the 1.1000 mark, which intersected with the Ichimoku cloud’s upper band. The advancing SMAs are defending the positive pattern. Despite a slight pause in the falling trajectory of the Ichimoku lines, they have yet to reflect any clear opposing shift to the negative price action. Nonetheless, the short-term oscillators are conveying mixed signals in directional momentum and thus are promoting [..]

Risk Warning: Your capital is at risk. Leveraged products may not be suitable for everyone. Please consider our Risk Disclosure.