XM does not provide services to residents of the United States of America.

Technical Analysis

post-image

Technical Analysis – USDJPY plunges to 1-month trough; indicators hold in oversold zone
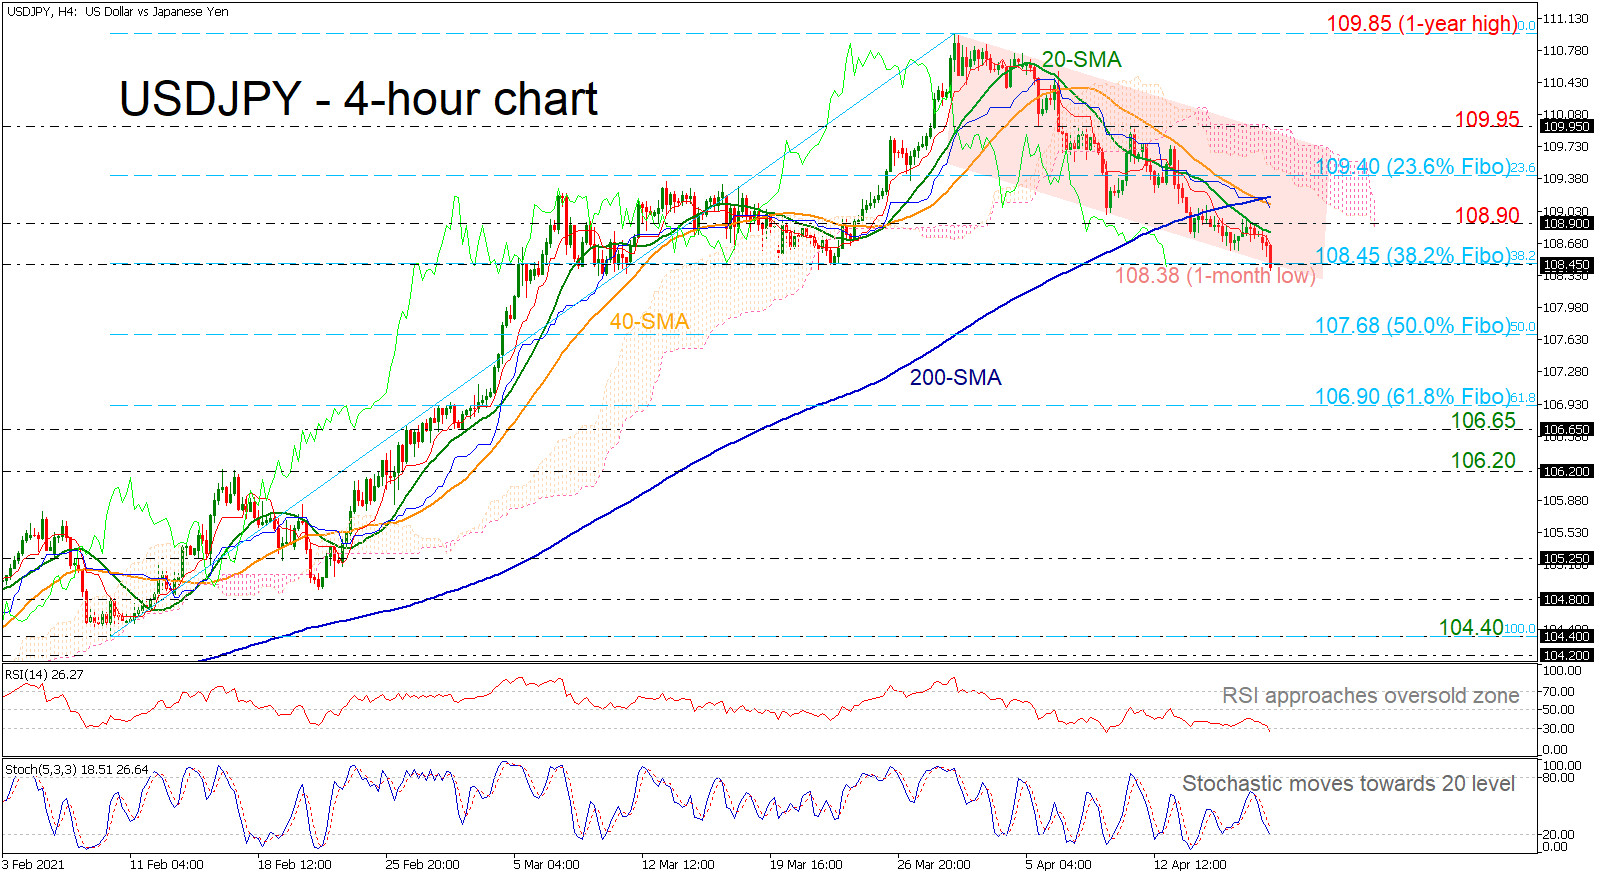
Posted on April 19, 2021 at 7:51 am GMT

USDJPY is retreating below the short-term simple moving averages (SMAs) and is creating a fresh one-month low of 108.45 today. The aggressive selling interest started from the one-year high of 109.85, with the technical indicators confirming the recent move. The RSI is heading south in the oversold zone, while the stochastic is approaching the negative territory. More decreases below the 38.2% Fibonacci retracement level of the up leg from 104.40 to 109.85 at 108.45 could take the pair until the [..]

Technical Analysis – EURUSD’s selling interest continues below 1.20

Posted on April 19, 2021 at 6:38 am GMT

EURUSD failed several times in the past three days to successfully surpass the 1.1985 crucial resistance and the 1.2000 handle. The price has been in a descending movement since January, remaining below the 100-day simple moving average (SMA) and the Ichimoku cloud. The RSI is flattening in the positive region, while the stochastic is looking overstretched as it is turning lower above the 80 level. A break of the 1.1985 obstacle and the 1.2000 handle could shift the bearish bias [..]

post-image

Technical Analysis – US 30 index maintains relentless ascent and breaches 34,000 hurdle

Posted on April 16, 2021 at 1:02 pm GMT

The US 30 stock index (Cash) seems to guarantee that the stable hike, which has overstepped the 34,000 mark, is here to stay. The unwavering simple moving averages (SMAs) are firmly defending the positive structure, while the rising Ichimoku lines and the short-term oscillators are echoing an absence of gravity in the current picture. The MACD, in the bullish region, is persisting above the fairly stabilised red trigger line, while the RSI is improving in overbought territory. Furthermore, the stochastic [..]

post-image

Technical Analysis – NZDUSD recoups losses but resistance zone silences ascent

Posted on April 16, 2021 at 8:54 am GMT

NZDUSD has recoiled to the red Tenkan-sen line at 0.7159 after its recent aggressive positive impetus hit a minor snag at the resistance section of 0.7180-0.7200. The former level happens to be where a plunge in the pair started back on March 22, which sent the pair to the four-month low of 0.6942. The rising 50- and 100-period simple moving averages (SMAs) are backing the latest bullish form in the pair. The stalling in the hike is being mirrored in [..]

Technical Analysis – USDCAD stuck in a bear trap; some bullish vibes are in the air

Posted on April 16, 2021 at 7:33 am GMT

USDCAD remained stuck below the long-term descending trendline and under the Ichimoku cloud for another week, but encouragingly, the 1.2515 support held firm on the downside, rejecting any close lower despite the fall to 1.2475 on Thursday. The latter strengthens the odds for an upside correction, with the Stochastics nicely backing this narrative too, as the indicator seems to have created a bullish double bottom around its 20 oversold mark. On the other hand, the RSI and the MACD keep hovering within [..]

Technical Analysis – GBPJPY pauses upside structure; 151.00 acts as resistance

Posted on April 16, 2021 at 6:32 am GMT

GBPJPY has been on the sidelines mostly this week as the 151.00 level and the short-term simple moving averages (SMAs) seem to be a real struggle for the bulls. Technically, the price could lose some ground in the near-term as the MACD is continuing the direction to the downside and towards its zero neutral mark, though the stochastics are warning over an oversold market, creating bullish cross within %K and %D lines. A rebound off the 149.50 support and near the upper surface of the [..]

post-image

Technical Analysis – EURUSD advances freeze ahead of 1.2000 mark

Posted on April 15, 2021 at 3:30 pm GMT

EURUSD has significantly improved extending above the simple moving averages (SMAs), yet it has come just short of the 1.2000 psychological number. The near-term rally, which found footing at the five-month low of 1.1703 has now retreated from the durable resistance of 1.1990. However the Ichimoku lines suggest that positive momentum has not yet abated. Furthermore, the bullish overlap of the 200-period SMA by the 50-period one and the gradual upturn of the 100-period SMA, together are endorsing extra price [..]

post-image

Technical Analysis – US 100 index heals wounds to reclaim record highs

Posted on April 15, 2021 at 1:32 pm GMT

The US 100 stock index (cash) surrendered its gains on the four-hour chart shortly after touching a new record high of 14,036 on Wednesday. The index is currently trying to recover the lost ground, with the RSI and the Stochastics promoting the bullish attempt as the former has refused to dive below its 50 neutral mark and the latter has rebounded from the oversold territory. A close above the all-time high of 14,036 could fade near the 14,200 psychological level. [..]

post-image

Technical Analysis – EURJPY pilots towards uptrend line after advances halt

Posted on April 15, 2021 at 1:13 pm GMT

EURJPY’s predominant bullish picture reached a 2½-year high at 130.67 but has recently succumbed to the resistance section of 130.49-130.78. Over the last month, the pair has been unable to surpass this key ceiling, which it has now reinforced with multiple peaks. All simple moving averages (SMAs) are shielding the uptrend. However, the adoption of a more neutral-to-bullish tone in the 50-period SMA specifically, suggests the price may continue to steer towards the trend line – pulled from the 125.08 [..]

Technical Analysis – USDCHF shapes steady decline; rebound looks feeble

Posted on April 15, 2021 at 6:36 am GMT

USDCHF appears to have moulded a stable descent from the nine-month peak of 0.9472, a key level where the pair collapsed back in July 2020. The completed bearish crossover of the 200-period simple moving average (SMA) by the 50-period one, as well as the gradual dipping of the 100-period SMA, is nourishing the negative structure. Nonetheless, the pair has bounced around the 0.9188 mark and is presently pushing over the Ichimoku lines, which are reflecting a pause in the downwards [..]

Risk Warning: Your capital is at risk. Leveraged products may not be suitable for everyone. Please consider our Risk Disclosure.