XM does not provide services to residents of the United States of America.

Technical Analysis

Technical Analysis – USDJPY plummets for consecutive days around 108.00

Posted on April 21, 2021 at 7:11 am GMT

USDJPY is edging sharply lower, creating consecutive red days after the pullback from the 13-month high of 110.95. The price looks to be creating a bearish correction of the upward rally from 102.60. From the technical perspective, the RSI is retreating in the negative territory, while the MACD is weakening its momentum below its trigger line and near the zero level. The 20-day simple moving average (SMA) is turning lower, while the price is standing below the short-term SMAs. Immediate [..]

post-image

Technical Analysis – EURCHF flickers a neutral-to-bearish tone

Posted on April 20, 2021 at 3:35 pm GMT

EURCHF’s consolidation is adopting a slightly more bearish demeanour on the four-hour chart as the price is challenging the 50-period simple moving average (SMA) and the Ichimoku cloud on the downside. The SMAs overall are emanating a growing negative tilt in the pair. The directionless Ichimoku lines are not indicating any clear price direction, while the short-term oscillators are leaning to the downside. The MACD is trailing below its red trigger line, slightly beneath the zero threshold, while the RSI [..]

post-image

Technical Analysis – Netflix stock holds trendless below July’s peaks ahead of earnings

Posted on April 20, 2021 at 9:57 am GMT

Netflix stock has been trendless since July 2020, ranging between a record high of 592.30 and a low of 457.45. Currently, there is little expectation for any sharp movement as the RSI is sidelining above its 50 neutral mark and the MACD is hovering around its red signal line. Yet, with the indicators maintaining an upward trajectory since the plunge in March, upside corrections are more likely than downside ones. A clear close above 565.00 could raise buying orders, likely driving the [..]

Technical Analysis – EURJPY pushes higher and validates bounce on uptrend line

Posted on April 20, 2021 at 9:06 am GMT

EURJPY has shifted into a higher gear, simultaneously thrusting above the 130.46 barrier and the 30-month high of 130.68, the former being the 161.8% Fibonacci extension of the down leg from 127.06 until 121.61. The steadily advancing simple moving averages (SMAs) are backing the bullish picture as are the Ichimoku lines. Furthermore, the short-term oscillators are favouring the upside, demonstrating the pickup in positive momentum, which helped the pair overstep the 130.46 limiting barrier. The MACD is in the positive [..]

post-image

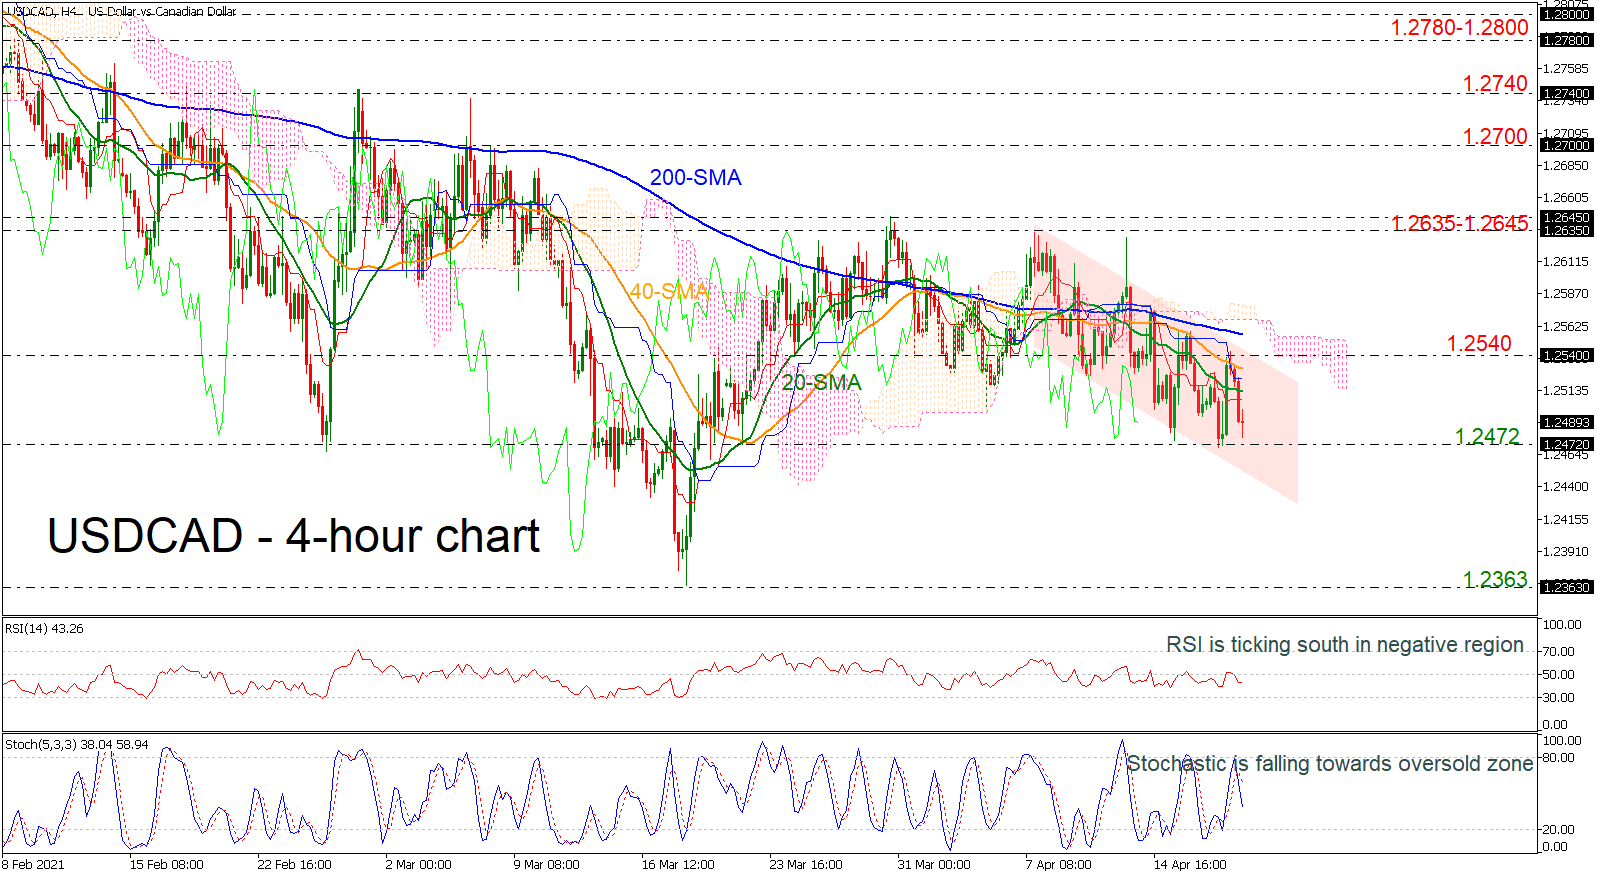
Technical Analysis – USDCAD retreats below 1.25; within descending channel

Posted on April 20, 2021 at 8:56 am GMT

USDCAD is decelerating within the descending channel, having retreated below the 1.2500 level and its short-term simple moving averages (SMAs) on the four-hour chart. The RSI is ticking lower in the negative region, while the stochastic is moving south towards the oversold zone. Immediate support could come from the latest low of 1.2472 before the focus turns to the 1.2363 barrier, taken from the troughs on March 18. On the flip side, an ascending move above the 20- and 40-period SMAs could face initial resistance around 1.2540. Slightly higher, the [..]

post-image

Technical Analysis – WTI oil futures point to higher prices

Posted on April 20, 2021 at 8:20 am GMT

WTI oil futures for June delivery held the reins above the support of 62.80, where the upper band of the Ichimoku cloud resides. The short-term risk is looking bullish at the moment as the RSI maintains a clear positive slope comfortably above its 50 neutral mark and the MACD strengthens above its red signal and zero lines. That said, not far above, the 64.85 region had been a hurdle back in March. Therefore, a close above it is likely required to bolster [..]

Technical Analysis – GBPUSD battles with 1.40; bullish bias is expected

Posted on April 20, 2021 at 6:46 am GMT

GBPUSD is battling with the strong 1.4000 psychological level, following the rebound off the long-term ascending trend line and the 1.3670 support. Moreover, cable jumped above the 20- and 40-day simple moving averages (SMAs) and the Ichimoku cloud. Looking at the technical indicators, the RSI is approaching the 70 level with weaker momentum than the previous session, while the stochastic is turning marginally lower in the overbought region. Stronger upside movements could meet the prior high of 1.4235, which is [..]

post-image

Technical Analysis – US 500 index ready to elevate all-time high

Posted on April 19, 2021 at 2:48 pm GMT

The US 500 stock index (Cash) is sustaining its bullish tone above the rising Ichimoku lines, which are nourishing the price’s attempts to steer higher. Additionally, the advancing simple moving averages (SMAs) are shielding the positive structure. The short-term oscillators are reflecting the resilience of the index to survive attempts to retrace to a certain degree. The MACD is keeping above its red trigger line in the positive region, while the RSI is sustaining its recent nudge into the overbought [..]

post-image

Technical Analysis – AUDUSD eases after sharp increase in near term

Posted on April 19, 2021 at 1:11 pm GMT

AUDUSD is under pressure as prices are drifting lower after a sharp upside move in the preceding two sessions. The short-term technical indicators are bearish and point to a possible weakness in the market. Looking at the 4-hour chart, the RSI indicator is sloping down after reaching the overbought territory, while the MACD is losing ground below its trigger line. However, the 40-period dimple moving average (SMA) is ready to complete a bullish cross with the 200-period SMA, suggesting that [..]

Technical Analysis – Gold recaptures its gloss; flickers green

Posted on April 19, 2021 at 9:46 am GMT

Gold seems to have reacquired some of its shine after the positive pivot at the 1,723 level. Surpassing the 1,759 upper frontier of the short-lived sideways market has resurrected the upside bias. The commodity’s recent climb is confirmed with bullish signals by a formed inverted hammer, followed by an engulfing bullish candle as the price steered clearly over the aforementioned 1,759 ceiling. The downward slopes of the 50- and 100-day simple moving averages (SMAs) have flattened out, reflecting opposing forces [..]

Risk Warning: Your capital is at risk. Leveraged products may not be suitable for everyone. Please consider our Risk Disclosure.