XM does not provide services to residents of the United States of America.

Technical Analysis

post-image

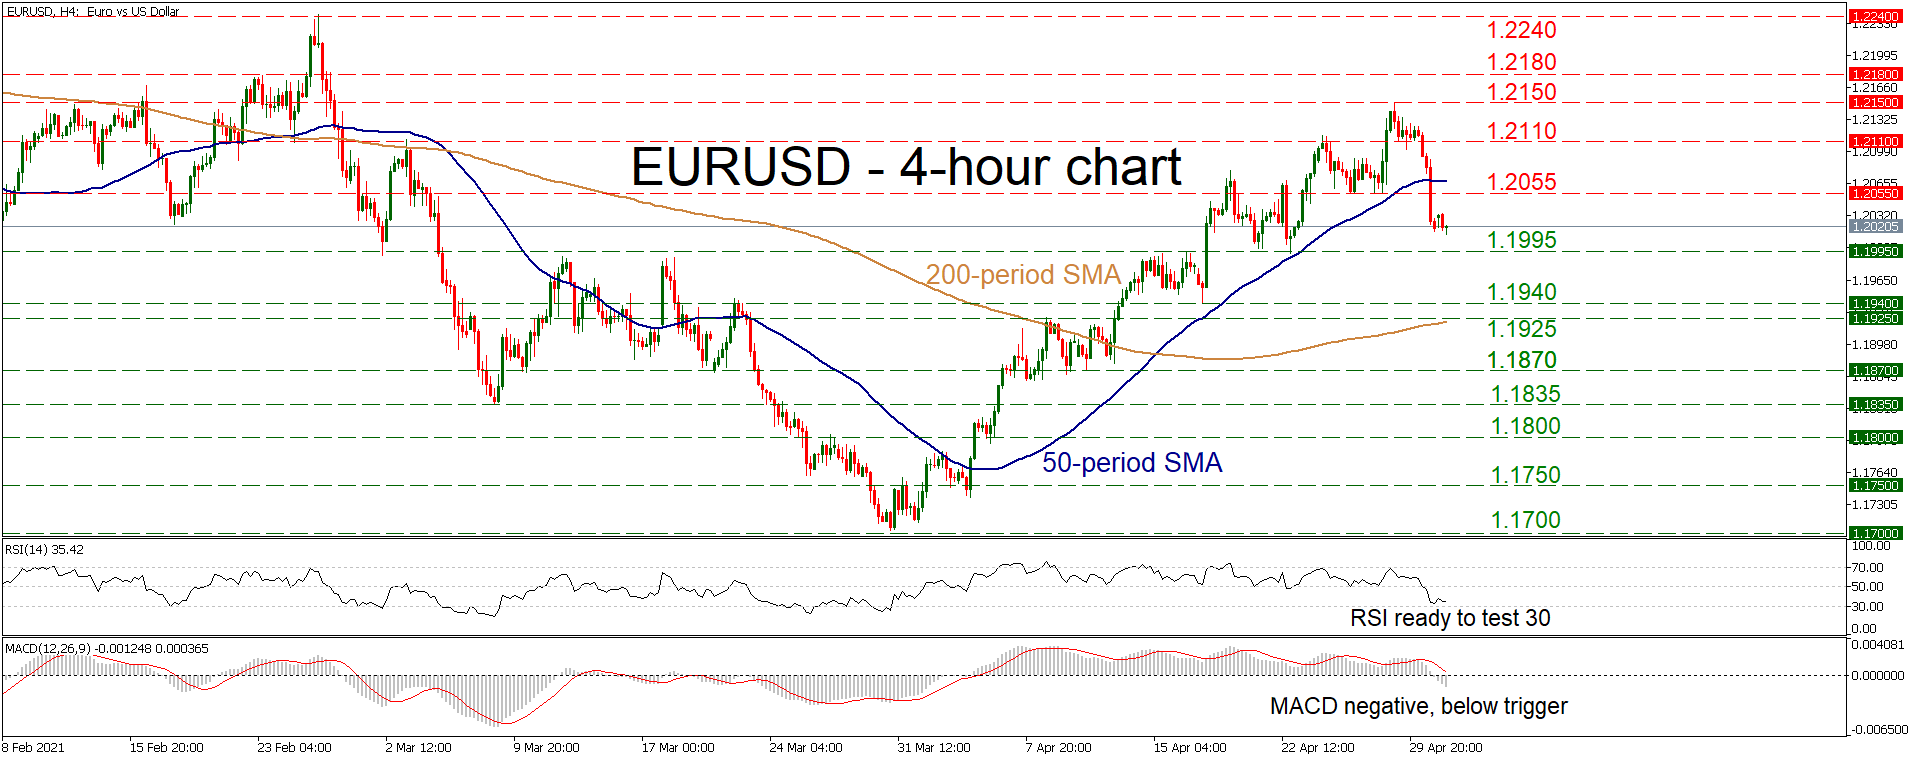
Technical Analysis – EURUSD absorbs losses but holds above crucial $1.20 region

Posted on May 3, 2021 at 6:53 am GMT

EURUSD took some heavy fire over the past few sessions, but the current structure of higher highs and higher lows does not appear to have been violated, keeping the recent rally in play for now. That said, a clear close below the critical 1.1995 support zone could change all that, shifting the positive structure back to neutral and setting the stage for further declines. The short-term oscillators reflect the latest drop in the market, with the RSI hovering just above [..]

post-image

Technical Analysis – WTI futures resume hike with weakened bullish backing

Posted on April 30, 2021 at 11:27 am GMT

WTI oil futures’ latest upside push is confronting the upper Bollinger band around 65.38, although current positive impetus appears somewhat frail. Not too far back the commodity formed a support base around 57.25-58.14 after retreating from the 28½-month peak of 67.96 and has since then been adhering to the lower boundary of an ascending channel. The climbing simple moving averages (SMAs) are defending the bullish structure, while the slight fading in the slope of the 50-day SMA is suggesting that [..]

post-image

Technical Analysis – USDCAD plunges as descending channel highlights bearish bias

Posted on April 30, 2021 at 8:26 am GMT

USDCAD has navigated to a 37½-month low; however, the pair’s negative momentum seems to be losing pace, respecting the support zone existing between the barriers of 1.2255 and 1.2195. Nonetheless, the gliding simple moving averages (SMAs) are affirming the negative trajectory, and together with the Ichimoku cloud continue to counter price improvements, confining the pair to the vicinity of the bearish channel. The Ichimoku lines and the short-term oscillators are slightly skewed to the downside. That said, price’s negative momentum [..]

post-image

Technical Analysis – EURJPY surges to 31-month high; indicators look overbought

Posted on April 29, 2021 at 12:40 pm GMT

EURJPY has been creating a sharp bullish rally over the last six consecutive four-hour sessions, climbing towards the 31-month high of 132.23. The technical indicators are suggesting strong positive bias. The RSI is standing in the overbought zone above the 70 level, while the MACD is holding above its trigger and zero lines in the near-term. The next strong resistance could come from the September 2018 high at 133.10 before moving towards the 137.50 barrier, this being the peak from January 2018. Alternatively, if [..]

post-image

Technical Analysis – USDCHF rises above 0.9100 but outlook is bearish

Posted on April 29, 2021 at 8:34 am GMT

USDCHF has been developing within a downward sloping channel since April 1. During the previous four-hour period, the price hit a two-month low at 0.9078 before ticking higher. The RSI is rising in the negative territory, suggesting an upside correction, while the MACD is still hovering beneath its trigger and zero lines in the near term. If the price continues to climb higher, immediate resistance could come from the 0.9130 barrier, which stands near the 20-period simple moving average (SMA). [..]

Technical Analysis – AUDUSD repowers optimism with prod above SMAs

Posted on April 29, 2021 at 7:46 am GMT

AUDUSD has re-established its neutral-to-bullish demeanour after nudging back above the 50- and 100-day simple moving averages (SMAs), and is currently tackling the upper Bollinger band around 0.7838 – just shy of the 0.7848 barrier. The bullish 100- and 200-day SMAs are guarding the positive structure, while the 100-day SMA and the more static 50-day SMA have provided the price with fresh footing to improve. Although the short-term oscillators are presently favouring the upside, they are indicating a phase where [..]

Technical Analysis – GBPJPY survives within bullish pipeline

Posted on April 29, 2021 at 7:20 am GMT

GBPJPY has been in the green over the past five days, gradually crawling towards the 151.00 area since the bounce near the bottom of a long-term channel,  which went back into action in March. The RSI has resumed its upward direction above its 50 neutral level, though the MACD has yet to gain momentum within the positive area, reflecting a cautious bullish bias. Note that the bearish cross between the red Tenkan-sen and blue Kijun-sen lines is still intact. On [..]

post-image

Technical Analysis – EURUSD loses momentum after flirting with 2-month high

Posted on April 29, 2021 at 7:02 am GMT

EURUSD appears to be maintaining an upside tendency as it is holding above the ascending trend line and the simple moving averages (SMAs). Earlier today, the pair reached a new two-month high of 1.2149, but it returned quickly lower, flirting with the 1.2100 handle. The mixed signals in the short-term oscillators further reflect downside retracement in the very short-term. The MACD has barely inched above its red trigger line in the positive region, while the RSI is heading south after [..]

post-image

Technical Analysis – GBPJPY tiptoes on 200-MA; negative pressures hinder improvements

Posted on April 28, 2021 at 1:51 pm GMT

GBPJPY has nudged above the 200-period simple moving average (SMA) around 150.93; however positive momentum appears to be frail and currently incapable of lifting the price much higher. No definitive price direction is being conveyed through the SMAs, yet the 50-period SMA is ready to positively overstep the 100-period SMA, adding some credence to bullish price action. Nonetheless, the pair remains within the confines of a short-term trading range between 149.04 and 151.93-152.27, while the technical oscillators are indicating that [..]

Technical Analysis – USDJPY regains footing and tussles 109.00 handle

Posted on April 28, 2021 at 9:27 am GMT

USDJPY is struggling to overcome the 109.00 hurdle, where the mid-Bollinger band also resides, after recovering some lost ground from a deep price correction from the 1-year high of 110.96. The soaring 50- and 100-day simple moving averages (SMAs) are endorsing the positive structure. It is apparent that positive momentum has picked up after the pair plotted a false break of the diagonal line, simultaneously bouncing off the lower Bollinger band, which overlapped the 107.53 support barrier. The short-term oscillators [..]

Risk Warning: Your capital is at risk. Leveraged products may not be suitable for everyone. Please consider our Risk Disclosure.