XM does not provide services to residents of the United States of America.

Technical Analysis

post-image

Technical Analysis – EURJPY rebounds off 131.00 and reactivates bullish bearing  

Posted on May 6, 2021 at 1:46 pm GMT

EURJPY is in the process of possibly plotting a fifth consecutive green candle, after finding some traction off the Ichimoku cloud’s lower boundary. The pair’s recent kick off the 131.00 handle has reinstated a bullish demeanour in the pair, realigning it with the broader positive outlook. The minor uptrend line pulled from the 125.08 trough and the simple moving averages (SMAs) are defending the pair’s upward trajectory. The clear frontrunner is upside momentum, something also being reflected in the Ichimoku [..]

post-image

Technical Analysis – EURUSD flashes green, aided by positive divergence

Posted on May 6, 2021 at 8:36 am GMT

EURUSD is improving from the 1.2000 mark after a price retracement from the two-month high of 1.2149 found a foothold in the region from 1.1992 to 1.1978, the latter being the 38.2% Fibonacci retracement of the up leg from 1.1703 until 1.2149. The 100- and 200-period simple moving averages (SMAs) are backing advances, while the dipping 50-period SMA is suggesting a dwindling in positive sentiment. The falling Ichimoku lines are promoting the pullback in price. However, this negative momentum is [..]

Technical Analysis – AUDUSD trendless within 0.7700 area; bias tilted to the downside

Posted on May 6, 2021 at 7:18 am GMT

AUDUSD continues to sideline inside the 0.7700 area and below the surface of the Ichimoku cloud for the third consecutive week, also remaining within the broader range of 0.7526 – 0.8006 since the start of the year. The short-term risk looks to be tilted to the downside, as the RSI has been making lower lows and lower highs since the end of April, while the MACD has been losing strength during the same period, recently crossing below its red signal [..]

Technical Analysis – WTI futures head up, approaching 2½-month high

Posted on May 6, 2021 at 6:49 am GMT

WTI futures are heading slightly north after the decline from the two-month high of 66.73. In trend indicators, the 20- and 40-day simple moving averages (SMAs) are creating a bullish crossover, standing near the uptrend line. The RSI is confirming the recent upside move, while the MACD oscillator is still moving above its trigger and zero lines. The price is trying to meet the next resistance of the two-and-a-half-year high of 67.96. If traders continue to buy the commodity, the [..]

post-image

Technical Analysis – Gold persists sideways as 1,800 border contests gains

Posted on May 5, 2021 at 8:12 am GMT

Gold is slipping below the mid Bollinger band, which has merged with the 50-period simple moving average (SMA) around 1,780 but the last two weeks of price action remain confined between the limits of 1,756 and 1,800. The 100- and 200-period SMAs are defending the latest up leg from the trough of 1,678 but the more static 50-period SMA is indicating the recent absence of necessary bullish sentiment. The short-term oscillators are reflecting stifled positive momentum and are marginally favouring [..]

post-image

Technical Analysis – GBPJPY eases after consecutive green sessions

Posted on May 5, 2021 at 8:10 am GMT

GBPJPY is turning lower after consecutive green sessions, finding strong support at the 200-period simple moving average (SMA). A paused state of directional momentum is reflected in the Ichimoku lines, while the price rests above the upper surface of the Ichimoku cloud. The mixed signals in the short-term oscillators further reflect the recent stall in the price. The MACD has barely inched above its trigger line in the positive region, while the RSI is heading marginally south. To the upside, [..]

Technical Analysis – USDJPY maintains bullish sentiment within channel

Posted on May 5, 2021 at 7:21 am GMT

USDJPY survived a drop below the bullish channel and avoided a close within the Ichimoku cloud a few weeks ago, drifting higher to re-challenge the 109.70 resistance area. The bulls have not claimed the 109.70 number yet, which could be the key for an extension towards the channel’s topline and the crucial zone of 110.65 – 110.95. However, they may step up their efforts in the near-term according to the RSI and the MACD, as the former is holding an [..]

Technical Analysis – NZDUSD pauses upside structure in near term

Posted on May 5, 2021 at 6:54 am GMT

NZDUSD is heading slightly up after the bounce off the 0.6940 support, hovering near the bullish crossover within the 20- and 40-day simple moving averages (SMAs). Technically, the indicators are showing mixed signals in the near term. The RSI is moving sideways near the neutral threshold of 50, while the MACD is declining below its trigger line but is still above the zero level. The stochastic is trying to exit from the oversold zone, indicating an upside movement. If the [..]

post-image

Technical Analysis – EURJPY hovers below 31-month high

Posted on May 4, 2021 at 8:59 am GMT

EURJPY is strongly positive as it reached a fresh 31-month peak at 132.40 on April 29. The MACD is standing beyond the trigger and zero lines, though, the RSI is losing ground above the 50 level. The short-term simple moving averages (SMAs) are heading north, approaching the current market price. The short-run risk is looking neutral-to-positive at the moment and another retest of the 132.40 high is likely. Particularly, a decisive close above the aforementioned level might what the bulls [..]

post-image

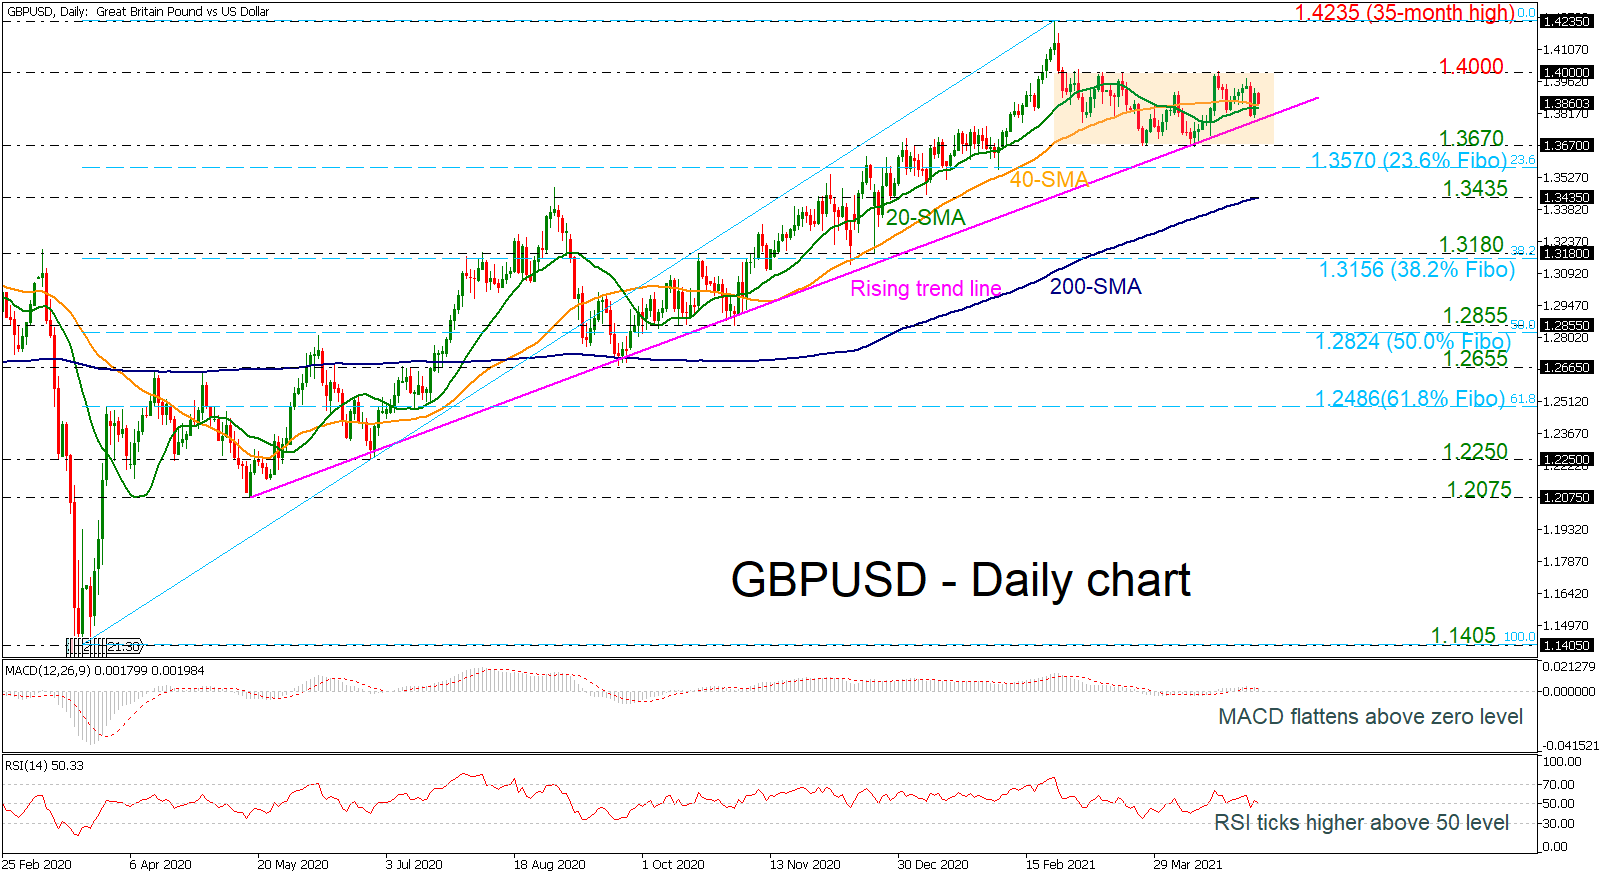
Technical Analysis – GBPUSD is smooth below 1.4000; neutral bias

Posted on May 4, 2021 at 7:22 am GMT

GBPUSD has been developing within a horizontal trajectory over the last two months, surpassing the 20- and 40-day simple moving averages (SMAs), which are ready to create a bullish crossover. The MACD oscillator is endorsing the sideways move, holding in the positive region, while the MACD is pointing up above the 50 level. Immediate resistance could be faced at the 1.4000 psychological level, which is acting as a significant barrier in the short-term. Stretching above this crucial line, the bulls [..]

Risk Warning: Your capital is at risk. Leveraged products may not be suitable for everyone. Please consider our Risk Disclosure.