XM does not provide services to residents of the United States of America.

Technical Analysis

post-image

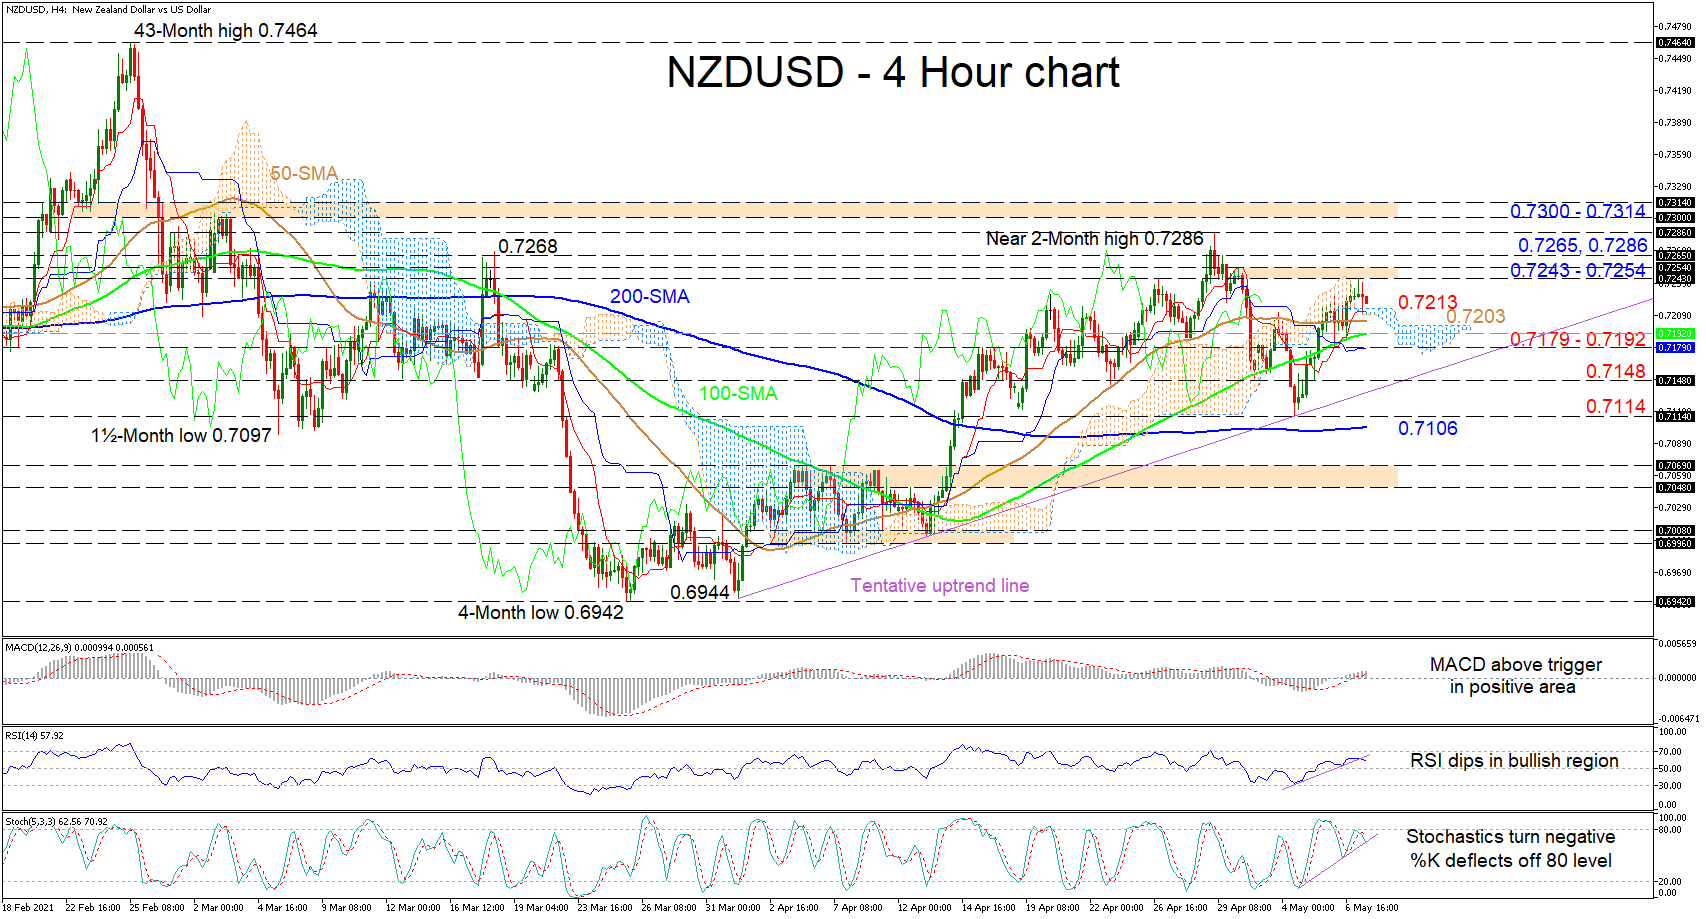
Technical Analysis – USDJPY eases in Ichimoku cloud below 109.00

Posted on May 10, 2021 at 1:28 pm GMT

USDJPY has been underperforming in the past four-hour sessions, trading within the Ichimoku cloud. The RSI is easing below the 50 level; however, the stochastic oscillator is showing some improvement. The bearish cross within the 20- and 40-period SMAs and the 200-period SMA is a signal for a negative tendency in the short-term. If price action remains below 109.00, there is scope to test the 108.35 barrier. Clearing this key level would see additional losses towards the one-month low of [..]

Technical Analysis – Gold presents bullish vibes and eyes 200-MA

Posted on May 10, 2021 at 7:08 am GMT

Gold is echoing its bullish intentions again after recently finding a toehold around the 1,756 level followed by extra traction off the mid-Bollinger band around 1,770. The flattening out of the 100-day simple moving average (SMA) and the slight upturn of the 50-day SMA are together suggesting downward sentiment is losing strength. The short-term oscillators are indicating that positive momentum is gathering pace, endorsing price’s newfound upward drive. The MACD is strengthening above its red trigger line in the positive [..]

Technical Analysis – EURUSD battles with 10-week high at 1.2150

Posted on May 10, 2021 at 6:18 am GMT

EURUSD jumped to a fresh ten-week high of 1.2176 earlier today before retreating lower. The price found strong support at the 1.1985 barrier and is holding well above the flat 100-day simple moving average (SMA) and the bullish cross within the 20- and 40-day SMAs. The RSI is sloping slightly down in the positive territory, while the stochastic oscillator is heading north. Immediate resistance to steeper increases could be encountered near the 1.2240 barrier, ahead of the 32-month high of 1.2348 [..]

post-image

Technical Analysis – CADJPY stretches to near 40-month high; positive backing intact

Posted on May 7, 2021 at 12:22 pm GMT

CADJPY appears to be taking a breather around its fresh multi-year high after its recent aggressive rally found traction off the 85.41 level and the Ichimoku cloud’s upper boundary. The soaring simple moving averages (SMAs) are shielding the upwards structure, while the Ichimoku lines are reflecting a pause in bullish sentiment. The short-term oscillators are signalling that positive momentum may shortly regain the upper hand. The MACD, some distance in the bullish territory, is strengthening above its red trigger line, [..]

post-image

Technical Analysis – NZDUSD fails to progress as bullish drive dwindles

Posted on May 7, 2021 at 9:33 am GMT

NZDUSD has hit a snag as upside momentum appears to have evaporated, indicating that the pair may struggle to further extend its recent bounce off the uptrend line pulled from the 0.6944 low. The 50- and 200-period simple moving averages (SMAs) are suggesting a more neutral price development towards the ascending line, whereas the 100-period SMA is backing additional price improvements. The Ichimoku lines are not transmitting a clear price direction, while the short-term oscillators are signalling that present sentiment [..]

post-image

Technical Analysis – GBPUSD develops within symmetrical triangle above 1.39

Posted on May 7, 2021 at 8:44 am GMT

GBPUSD has been developing within a symmetrical triangle following the upside movement from the seven-week low of 1.3670 in the 4-hour chart. The RSI is gaining momentum in the positive territory, however, the MACD oscillator is moving sideways near the zero level. The 20- and 40-period simple moving averages (SMA) are flattening slightly below the current market price, while the steady 200-period SMA could potentially act as a strong support to sharp downside corrections. In the case that bulls take the upper hand and send the market above the descending [..]

Technical Analysis – USDCAD tests 2017 lows in oversold area; downtrend to hold

Posted on May 7, 2021 at 7:22 am GMT

USDCAD crashed below the 2018 trough of 1.2248 on Thursday, stretching its long-term downtrend towards the critical 1.2150 – 1.2060 zone, where the price bottomed back in 2017. A rebound, or at least a sideways trading, cannot be ruled out in the short term as the RSI is looking set to change course in the oversold area. On the other hand, the Stochastics, although below the 80 oversold mark, show no sign of strength, while the MACD continues to weaken in the [..]

Technical Analysis – US 30 index reaches another record high; indicators look overbought

Posted on May 7, 2021 at 6:57 am GMT

The US 30 index achieved a fresh all-time high around 34,580 earlier today after several days of sideways moves. Currently, the price is hovering near its opening level with the RSI confirming the flat momentum. Moreover, the stochastic oscillator is jumping in the overbought territory suggesting that the upside extension on price may come to an end. If the index successfully jumps to uncharted levels, it may find a strong obstacle near the next psychological marks such as 35,000, 35,500 and 36,000. In the negative scenario, [..]

post-image

Technical Analysis – USDCHF echoes bearish objectives with its deep pullback  

Posted on May 6, 2021 at 3:19 pm GMT

USDCHF is trying to break below the 200-day simple moving average (SMA) around the 0.9085 mark, a point at which the 100-day SMA is currently trying to complete a bullish crossover. The 50- and 100-day SMAs are promoting a neutralising force to help the pair creep sideways towards the long-term tentative downtrend line, drawn from the 1.0235 peak. The bearish tone of the Ichimoku lines is indicating negative momentum may soon regain clear dominance in the pair. The short-term oscillators [..]

post-image

Technical Analysis – EURCAD at a make-or-break point; negative risks linger

Posted on May 6, 2021 at 2:49 pm GMT

EURCAD was hit by a sharp selling wave last week, erasing the sparkle from early April to meet the crucial support zone of 1.4723. Unless the pair manages to pivot at this point, the bears could gain extra steam likely towards the 1.4580 restrictive zone, while a deeper freefall may seek support around the 1.4455 number. From a technical perspective, oversold signals are flashing red, but the bears could stay on board in the short term as the fast-Stochastics have yet to change [..]

Risk Warning: Your capital is at risk. Leveraged products may not be suitable for everyone. Please consider our Risk Disclosure.