XM does not provide services to residents of the United States of America.

Technical Analysis

post-image

Technical Analysis – USDCAD needs strong boost to avoid 6-year low again

Posted on May 18, 2021 at 1:06 pm GMT

USDCAD is ticking up marginally after it reached a more-than-six-year low at 1.2012. The technical indicators are suggesting an upside recovery after the strong selling interest. The RSI is pointing north following the rebound off the 30 level, while the stochastic posted a bullish crossover in the oversold territory. Immediate resistance could come from the 1.2045 barrier before jumping towards the 20- and 40-period simple moving averages (SMAs) at 1.2105, which stands near the lower surface of the Ichimoku cloud. Even higher, the 23.6% Fibonacci [..]

Technical Analysis – GBPUSD elevates toward multi-year high; bullish tone grows

Posted on May 18, 2021 at 7:47 am GMT

GBPUSD has acquired buoyancy after recently returning above the Ichimoku cloud and is now clearly eyeing the 34-month peak of 1.4236. The bullish simple moving averages (SMAs) are safeguarding the broader uptrend, while the Ichimoku lines are indicating that positive momentum is picking up. The short-term oscillators appear skewed to the upside and are signalling that bullish sentiment is intensifying. The MACD is strengthening above its red trigger line in the positive region, while the RSI is manoeuvring towards the [..]

Technical Analysis – EURJPY trades bullish along resistance line

Posted on May 18, 2021 at 7:03 am GMT

EURJPY extended its upward trajectory towards a new 32-month high of 132.94 on Monday but the bullish action was mostly anemic during the day as the strong resistance line kept upside pressures under control once again. Downside corrections would not be surprising in the short-term as the price has been fluctuating along the line for a couple of days. The RSI and the Stochastics are somewhat in line with this narrative as the former is fluctuating marginally below its 70 overbought mark, [..]

post-image

Technical Analysis – WTI futures consolidate above 66.00 in near term

Posted on May 18, 2021 at 6:21 am GMT

WTI futures have been trading within a consolidation area of 63.09-66.63 since April 28. The price found support at the 20- and 40-period simple moving averages (SMAs) and is moving towards the 66.63 resistance level. The MACD oscillator is strengthening its bullish structure above its trigger and zero lines, however, the RSI is pointing slightly down in the positive region. A successful rally above 66.63 could take the commodity until the 67.93 barrier, registered on March 8. More aggressive buying [..]

post-image

Technical Analysis – Silver powers up in bullish channel; upside risks grow  

Posted on May 17, 2021 at 3:20 pm GMT

Silver is extending above the two-and-a-half-month high of 27.87, achieved on May 10, and appears to be eyeing the upper frontier of the bullish channel formation on the four-hour chart. The advancing simple moving averages (SMAs) are aiding the bullish structure, while the Ichimoku lines are reflecting the pickup in positive sentiment. The short-term oscillators are indicating that bullish momentum is increasing. The MACD is beyond the zero threshold and is strengthening above its red trigger line, while the RSI [..]

post-image

Technical Analysis – AUDUSD upside obstacles prove significant to mute gains  

Posted on May 17, 2021 at 1:08 pm GMT

AUDUSD is surrendering more ground after the Ichimoku cloud declared the pair’s latest price progression out of the 0.7674-0.7706 support base temporary, and lacking necessary bullish drive to pilot for the 0.7900 mark. The persistent gradual incline in the simple moving averages (SMAs) is conveying a neutral-to-bullish preference. Nonetheless, limited positive impetus remains incapable of lifting the price beyond the cloud, something also being reflected in the Ichimoku lines and the short-term oscillators. The MACD, in the negative zone, is [..]

post-image

Technical Analysis – US 500 index flirts with 200-day SMA below record high

Posted on May 17, 2021 at 9:08 am GMT

The US 500 (cash) index is approaching the 200-day simple moving average (SMA), posting couple of days of gains after the fall from the record high of 4,244.05. More advances could meet the aforementioned high before inserting into uncharted levels such as 4,300, 4,400 and 4,500. The RSI is confirming the positive outlook as it is heading north, entering the bullish territory, however, the MACD is still moving lower, remaining below the trigger line. The Ichimoku cloud is suggesting more [..]

Technical Analysis – EURUSD acquires toehold to safeguard bullish tone

Posted on May 17, 2021 at 7:47 am GMT

EURUSD has found fresh traction off the minor tentative uptrend line, pulled from the 1.1703 trough, and the mid-Bollinger band, both in the vicinity of 1.2083. The slight upturn in the 50-day simple moving average (SMA) combined with the rising 200-day SMA, are together endorsing price improvements, while the 100-day SMA has yet to regain its positive demeanour. Despite mixed signals in directional momentum, the short-term oscillators seem to be tightening downside defences that lie between the mid-Bollinger band and [..]

Technical Analysis – Gold in the middle of two trend reversal patterns

Posted on May 17, 2021 at 7:14 am GMT

Gold has been faithfully underpinning the bullish double bottom structure since the break above the neckline of 1,756 in mid-April, making higher highs and higher lows up to a more than 3-month high of 1,855 today. However, whether the precious metal can stretch its short-term trend reversal pattern beyond the long-term bearish channel remains to be seen as the RSI and the Stochastics are within striking distance of their overbought levels. The price itself is trading along the upper Bollinger band for the second day, [..]

post-image

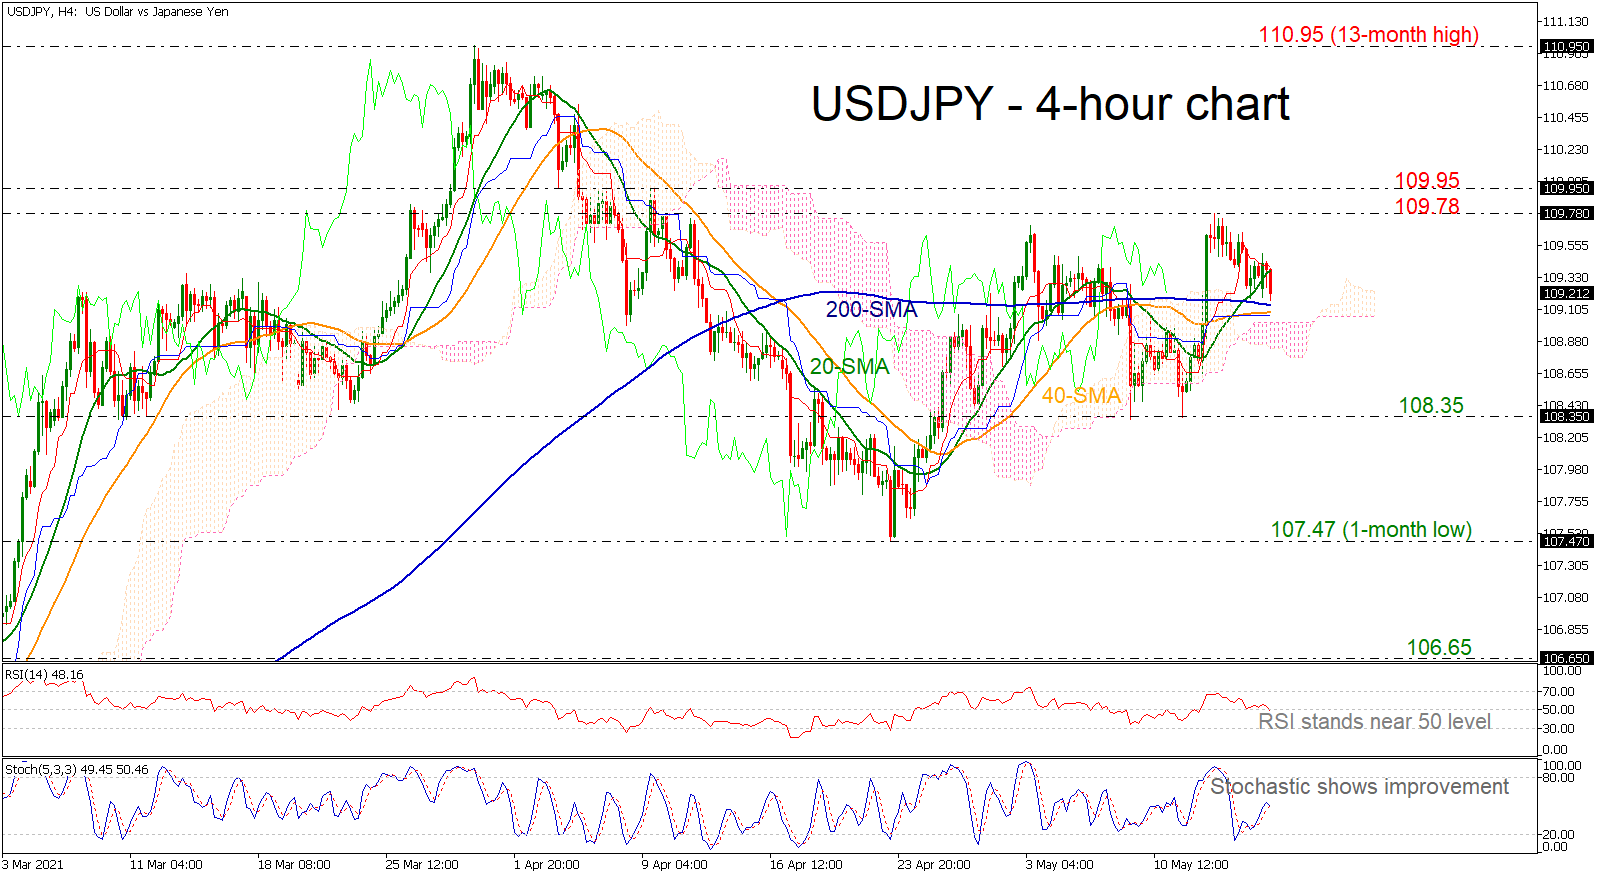
Technical Analysis – USDJPY meets 200-period SMA; 109.00 still holds

Posted on May 17, 2021 at 7:02 am GMT

USDJPY is retreating after it topped at the 109.78 resistance level. The price is finding support at the 200-period simple moving average (SMA). The RSI seems to be in a declining mode, however, the stochastic oscillator is posting a bullish crossover within the %K and %D lines in the four-hour chart. If there are any dives beneath the SMAs, the lower surface of the Ichimoku cloud could halt bearish movements at 108.75 before tumbling to the 108.35 support level. Even lower, the one-month [..]

Risk Warning: Your capital is at risk. Leveraged products may not be suitable for everyone. Please consider our Risk Disclosure.