XM does not provide services to residents of the United States of America.

Technical Analysis

post-image

Technical Analysis – Silver bulls return with a bang

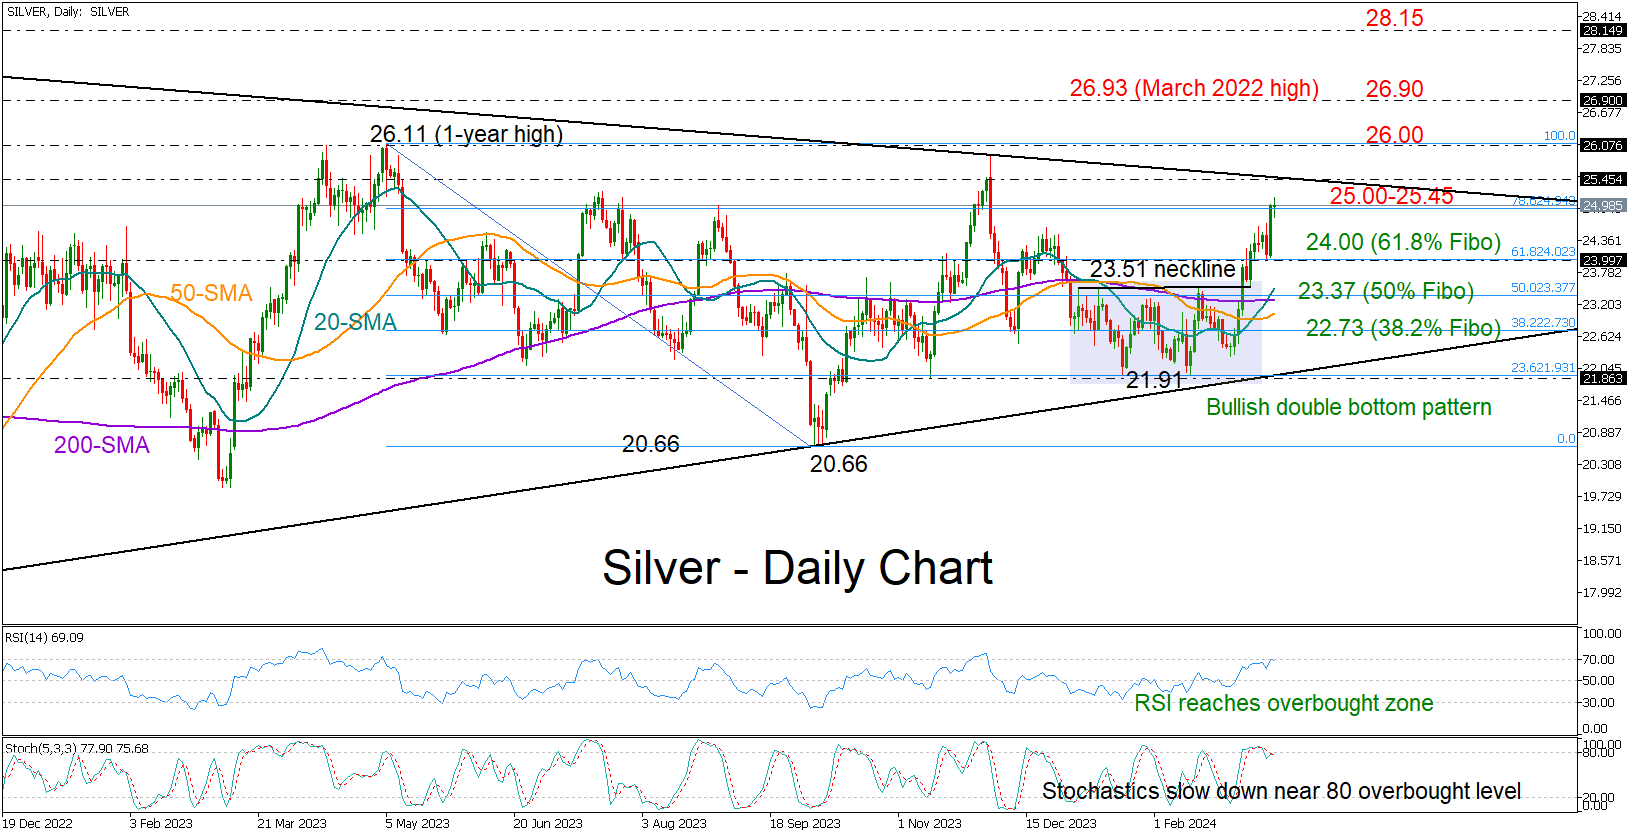
Posted on March 14, 2024 at 12:43 pm GMT

Silver marks new higher highs in the year to date Some caution required as former resistance area is nearby   Silver bulls roared back during Wednesday’s late European trading hours, with the metal soaring to a more-than-three month high of 25.14 before closing marginally below the 25.00 round level. The completion of a double bottom pattern around the 21.91 floor led to a bullish explosion, as the price advanced above the neckline of 23.51. While the bullish market structure in the short-term [..]

post-image

Technical Analysis – US 30 index edges higher to record peak

Posted on March 14, 2024 at 10:42 am GMT

US 30 index pulls back off rising trend line Stochastics endorse the bullish tendency The US 30 (cash) index is flirting again with the all-time high of 39,284.42 after the bounce off the 38,450 support level, which overlaps with the long-term ascending trend line. According to the technical oscillators, the MACD is trying to cross above its trigger line in the positive territory, while the stochastic is running towards the overbought region after the bullish cross within the %K and [..]

Technical Analysis – AUDUSD waits for direction after bullish break

Posted on March 14, 2024 at 9:40 am GMT

AUDUSD squeezed between key levels Traders indecisive ahead of US retail sales   AUDUSD regained positive momentum and climbed above its exponential moving averages (EMAs) after breaking out of its 2024 bearich channel. But the 0.6620 region, which was a tough barrier in January, dented the upside forces following the flash spike to 0.6666. The technical indicators are sending mixed signals, though the nearby support area of 0.6600, which has been limiting downside movements, is preserving a ray of hope that the [..]

Technical Analysis – WTI oil futures fight with 80.80 bar

Posted on March 14, 2024 at 8:35 am GMT

WTI crude rebounds off 200-day SMA Remains in an uptrend in the short-term WTI oil futures are finding a strong support level near the 200-day simple moving average (SMA) at 78.00 and are also struggling to jump beyond the 80.80 resistance. The price has been in an uptrend since mid-December with the technical oscillators suggesting a neutral to bullish bias. The RSI is pointing north above the 50 territory, while the MACD is moving sideways below its trigger line and above the zero level. If the market [..]

post-image

Technical Analysis – Copper rises rapidly to 11-month high

Posted on March 13, 2024 at 4:14 pm GMT

Copper wins nearly 3.0% on production cuts Overbought signals detected around key resistance   Copper futures (May delivery) surged to an almost one-year high of 4.04 on Wednesday after China’s biggest producers agreed on a rare supply cut amid raw material shortages. Technically, the 61.8% Fibonacci retracement of the 2023 downtrend is currently under examination. A step above that border could lift the price instantly into the 4.12-4.17 zone, where the 78.6% Fibonacci mark is positioned. If upside pressures persist above 4.20, [..]

post-image

Technical Analysis – NZDUSD  holds within consolidation area

Posted on March 13, 2024 at 10:09 am GMT

NZDUSD finds support at short-term SMAs RSI and MACD still above mid-levels NZDUSD has been consolidating within a trading range of 0.6035 to 0.6215 over the last two months, remaining above the 200-day simple moving average (SMA). Currently, the 20- and the 50-day SMAs are acting as strong support lines with the technical oscillators indicating a slight upside move. The RSI is ticking north above the neutral threshold of 50, while the MACD is still standing in the positive territory. [..]

post-image

Technical Analysis – Intel stock battles with 50-day SMA

Posted on March 13, 2024 at 9:51 am GMT

Intel shares advance after consolidation period But struggle to conquer the 50-day SMA Momentum indicators turn positive Intel’s stock had been stagnant since late January, following a significant bearish price gap in the aftermath of the firm’s Q4 earnings announcement. Although the price attempted a recovery in the past few sessions, the 50-day simple moving average (SMA) seems to be acting as a strong ceiling. If bullish pressures persist and the price conquers the 50-day SMA, immediate resistance could be [..]

Technical Analysis – EURGBP starts to take a bullish shape

Posted on March 13, 2024 at 9:31 am GMT

EURGBP gets rejected near 50-day SMA after rebound Market structure develops into a bullish double bottom pattern Buyers need a rally above 0.8577 to dominate   EURGBP could not surpass its 50-day simple moving average (SMA) at 0.8553 on Tuesday. However, the bullish double bottom pattern, which started to take shape around February’s base of 0.8500, might generate buying interest in the coming sessions in hopes the pair will soon stage an upside trend reversal. The technical indicators have turned upwards, [..]

post-image

Technical Analysis – Gold advances again after rebound off 2,150

Posted on March 13, 2024 at 8:21 am GMT

Gold turns up after negative retracement Technical signs are mixed Gold prices rebounded off the 2,150 support level after creating a bearish correction from the strong rally towards the fresh all-time high of 2,195 on Friday in the 4-hour chart. The technical oscillators are showing some contradicting signs as the MACD is losing momentum beneath its trigger line. However, the stochastic is gaining some momentum following the bullish crossover within the %K and %D lines in the oversold territory. If the [..]

Technical Analysis – USDJPY stuck inside a key range

Posted on March 13, 2024 at 7:48 am GMT

USDJPY trades sideways in anticipation of next week’s key events USDJPY’s correction halted a tad above the 200-day SMA Momentum indicators support the bearish trend but with less conviction USDJPY is trying to record a green candle today as it tests the resistance set by the 146.65-148.28 range. The correction from the late February highs halted at the 200-day simple moving average (SMA) with market participants potentially positioning for the key events ahead, which include wage talk results and next week’s [..]

Risk Warning: Your capital is at risk. Leveraged products may not be suitable for everyone. Please consider our Risk Disclosure.