XM does not provide services to residents of the United States of America.

Technical Analysis

post-image

Technical Analysis – GBPJPY abates a tad from 156 but keeps bullish vibe

Posted on June 9, 2021 at 3:20 pm GMT

GBPJPY has managed to gradually fade from the near 40-month peak of 156.06, and below the 50- and 100-period simple moving averages (SMAs). However, the pair seems to be finding some support near the 154.40 barrier, which happens to be the 23.6% Fibonacci retracement of the up leg from 149.04 until the 156.06. The 200-period SMA at 153.54 continues to endorse the bullish structure. The short-term oscillators are signalling some waning in negative momentum. The MACD below the zero threshold [..]

Technical Analysis – USDJPY recoils to 50-SMA but upside risks still in force

Posted on June 9, 2021 at 8:08 am GMT

USDJPY has formed a higher low around the mid-Bollinger band and the 50-day simple moving average (SMA), keeping the minor uptrend alive, which began from the 107.47 trough. The 100- and 200-day SMAs are backing improvements in the pair, while the short-term oscillators are signalling that positive sentiment may be picking up. The MACD, in the bullish region, is barely beneath its flattened red trigger line, while the RSI is trying to sustain its bounce off the 50 level. The [..]

Technical Analysis – GBPAUD still on the sidelines, but trend optimism seems to be growing

Posted on June 9, 2021 at 7:05 am GMT

GBPAUD continues to trade within a broad range, but the slow pace of higher highs and higher lows from the two-year low of 1.7413 registered in January, and the recent bullish intersection between the simple moving averages (SMAs) could be an encouraging sign of trend improvement. As regards the price momentum, the technical oscillators keep the short-term bias on the bearish side as the RSI is trending downwards to meet its 50 neutral level, and the MACD is losing strength [..]

post-image

Technical Analysis – Gold weakens the strong upside trend below 1,900

Posted on June 9, 2021 at 6:09 am GMT

Gold prices posted couple of flat days within the 20- and 40-period simple moving averages (SMAs) in the 4-hour chart. The neutral bias also supported by the RSI, which has been hovering near the 50-neutral level in the past few days and is failing to cross into positive territory. However, the stochastic is trying to pick up steam, creating a bullish crossover within the %K and %D lines. Should the pair manage to strengthen its longer-term positive momentum, the next [..]

post-image

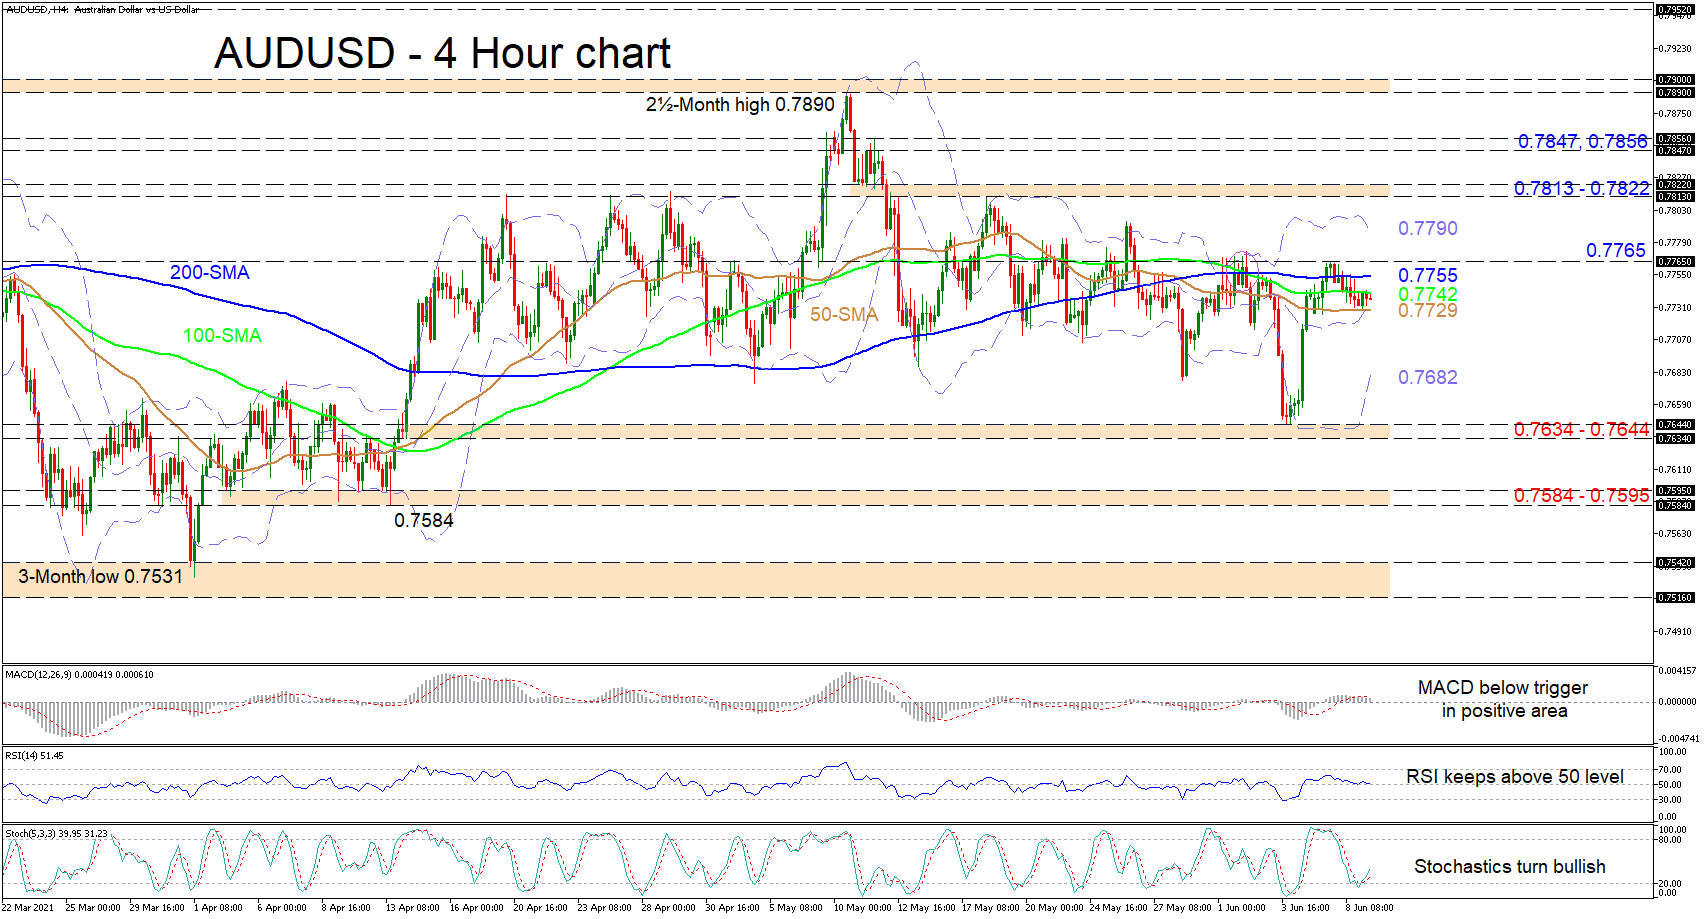
Technical Analysis – AUDUSD echoes neutral tone as price fuses between MAs

Posted on June 9, 2021 at 5:15 am GMT

AUDUSD is currently around the mid-Bollinger band and price action has become constricted to the vicinity of the static simple moving averages (SMAs). The SMAs are now endorsing a horizontal market. Moreover, the short-term oscillators are transmitting mixed signals in directional momentum. The MACD, in the positive zone, is slightly below its floating red trigger line, while the RSI is fighting to remain north of the 50 threshold. The bullish stochastic oscillator is mirroring an increase in strength in the [..]

post-image

Technical Analysis – EURCHF plummets to new 3½-month trough

Posted on June 8, 2021 at 1:05 pm GMT

EURCHF is tumbling to a fresh three-and-a-half-month low of 1.0910 today, supporting the negative outlook in the near term. The RSI is flirting with the 30 level, while the stochastic is entering the oversold territory. The 20- and 40-period simple moving averages (SMAs) completed a bearish crossover, confirming the recent dive. In case of steeper declines the door could open for the 1.0890 support, registered in December 2020, while if the bears continue to sell the pair, the 1.0867 barrier, [..]

post-image

Technical Analysis – USDCAD moves sideways above 6-year low

Posted on June 8, 2021 at 9:01 am GMT

USDCAD extended its one-month trading range above the more-than-six-year low of 1.2006, increasing speculation that the bears are losing steam and the bulls may take charge soon. Still, unless the 1.2145 – 1.2160 area gives way, a negative move towards the 1.2006 barrier is likely. Underneath this level, the door would open for the 1.1920 support, taken from the low in February 2015. Nevertheless, if the bulls win the battle with the 1.2145 hurdle and the 23.6% Fibonacci retracement level of the down leg from 1.2645 [..]

Technical Analysis – GBPUSD lingers around 1.41 as positive forces dry up

Posted on June 8, 2021 at 8:36 am GMT

GBPUSD is tiptoeing across the 1.4095 level, which happens to be the 150.0% Fibonacci extension of the down leg from 1.3200 until 1.1410, after multiple attempts in the pair failed to defeat the 1.4236 peak from February 24. Nonetheless, the bullish simple moving averages (SMAs) are safeguarding the uptrend. The currently idle Ichimoku lines are demonstrating a loss of positive impetus; however, they are retaining a slight tilt to the upside. Additionally, the short-term oscillators are mirroring the minor dwindling [..]

Technical Analysis – EURJPY favors uptrend, but close to 2017 resistance

Posted on June 8, 2021 at 7:49 am GMT

EURJPY ran out of bullish steam around a new 3-year high of 134.11 last week, with the price shifting southwards to seek support near the 20-day simple moving average (SMA) at 133.13. The pair is currently trading comfortably above the key ascending trendline, and the positive gap between the 20- and 50-day SMAs has further widened, increasing speculation that the upward pattern could see more extensions before fading out. As regards the price momentum, some weakness cannot be ruled out [..]

post-image

Technical Analysis – WTI futures deep below 69.00; indicators are mixed

Posted on June 8, 2021 at 7:44 am GMT

Since their deep fall towards 68.50, WTI crude oil futures have been going back and forth below the 20-period simple moving average (SMA) from the 32-month peak of 69.98. The technical picture is mixed as the RSI is lacking direction around its neutral threshold of 50, while the MACD supports that the pullback to the downside is likely to continue in the short term. In case of negative pressures, the market could meet support at the 68.25 barrier before it [..]

Risk Warning: Your capital is at risk. Leveraged products may not be suitable for everyone. Please consider our Risk Disclosure.