XM does not provide services to residents of the United States of America.

Technical Analysis

post-image

Technical Analysis – US 100 index flirts with 14,000 after quick bounce

Posted on June 11, 2021 at 12:24 pm GMT

The US 100 stock index (cash) is flirting with the 14,000 mark thanks to Thursday’s speedy rebound on the 50-period simple moving average (SMA) in the four-hour chart. While the price is currently trying to resume its ascent, a downside reversal is now looking increasingly possible as the RSI has diminished near its 70 overbought level, which was a resistance regions a few days ago. The ascent in the Stochastics also seems to have peaked above the 80 overbought level, [..]

post-image

Technical Analysis – NZDUSD touches SMAs in a declining tendency

Posted on June 11, 2021 at 9:42 am GMT

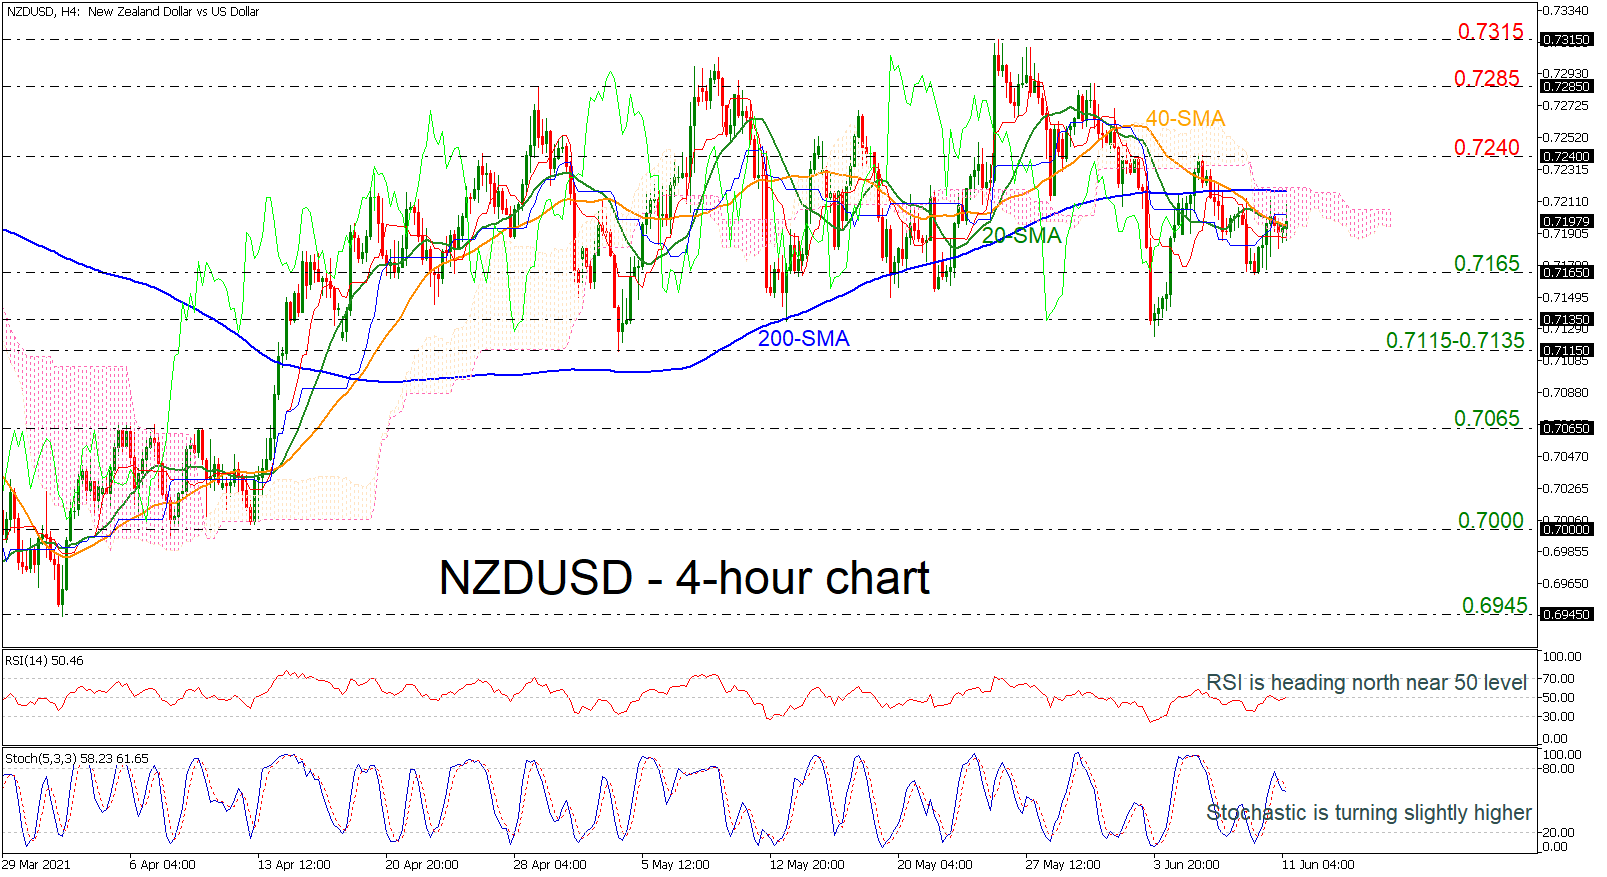
NZDUSD has been in a slightly upside movement over the last 4-hour sessions, flirting with the downward sloping 20- and 40-period simple moving averages (SMAs). Broadly, the pair is trading within a descending formation, while a break above the 200-period SMA may determine the next trend direction. Looking at momentum oscillators, they suggest further neutral-to bearish movements may be on the cards in the short-term. The RSI is near its neutral 50 line, detecting flat momentum; however, the stochastic oscillator [..]

Technical Analysis – USDCAD tiptoes above 1.20, but bearish picture endures

Posted on June 11, 2021 at 8:25 am GMT

USDCAD is consolidating around the level of 1.2060, which happens to be a key trough achieved in early September 2017, after its most recent deflection off the upper frontier of the descending channel. The bearish simple moving averages (SMAs) are still weighing on the pair that has ticked to 6-year lows of 1.2012 and 1.2006, near the 1.2000 barrier, where the price seems to have shaped a floor. Although the red Tenkan-sen line is reflecting a dry up in negative [..]

Technical Analysis – GBPJPY freezes pullback near 20-SMA; bullish trend present

Posted on June 11, 2021 at 7:41 am GMT

GBPJPY balanced the soft pullback off the long-term resistance line near the 20-day simple moving average (SMA) and around May’s hurdle of 154.80, maintaining the series of higher highs and higher lows in the long-term picture. The technical signals are mixed as the MACD and the RSI continue to point downwards, whereas the fast-Stochastics are rotating northwards. The 2018 peak of 156.59 will be the next target if buying pressures temper above the 20-day SMA, while beyond that, the door would open [..]

post-image

Technical Analysis – GBPUSD advances above Ichimoku cloud; neutral in short-term

Posted on June 11, 2021 at 7:05 am GMT

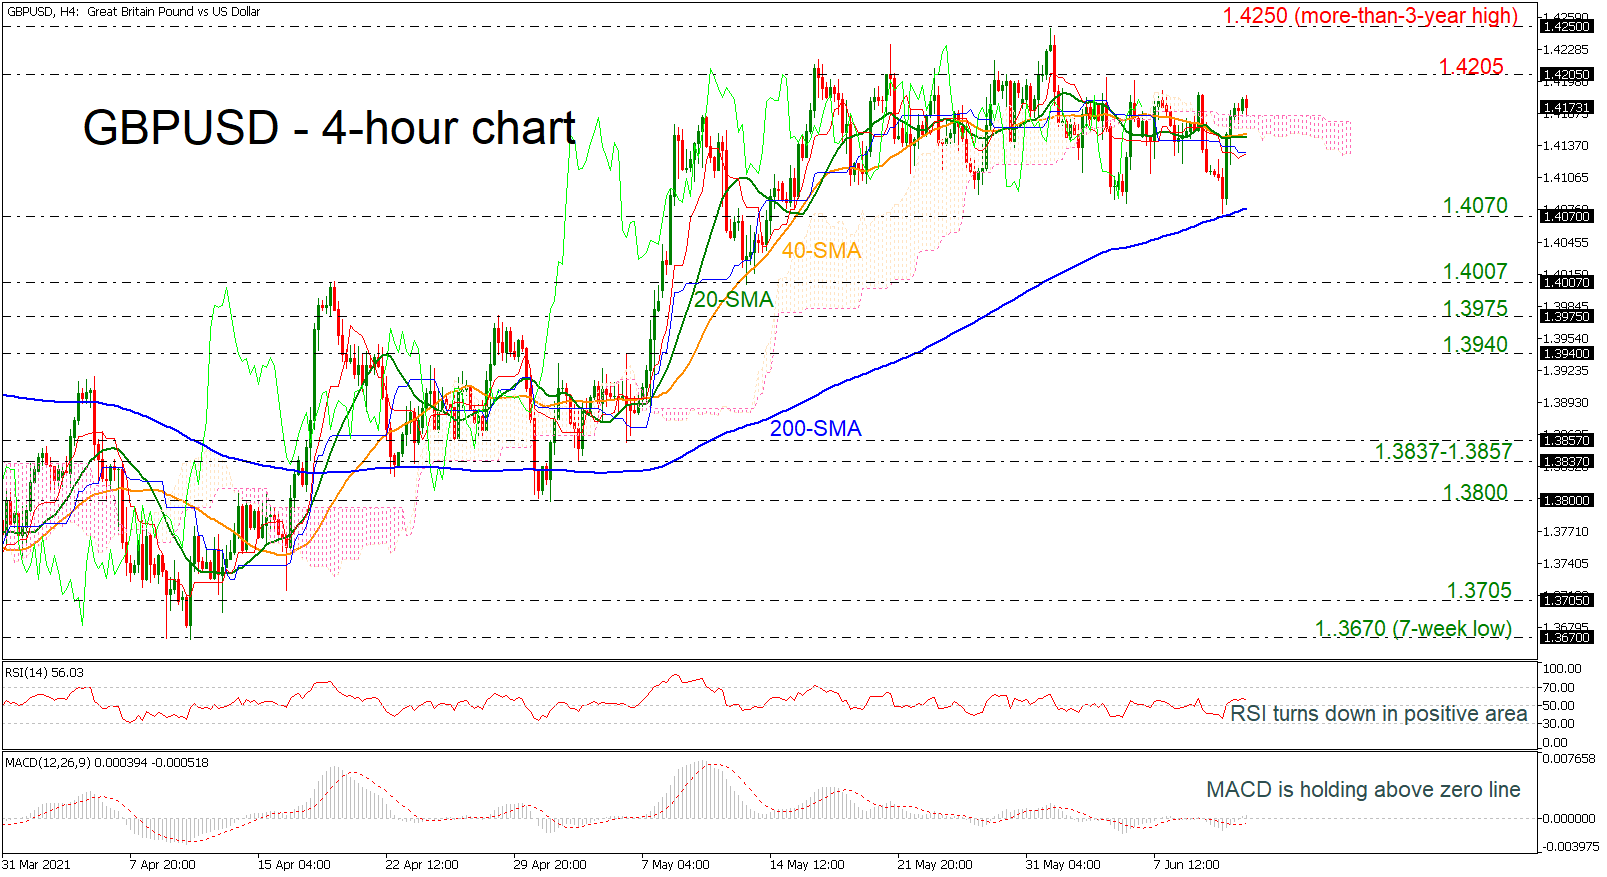
GBPUSD is climbing above the Ichimoku cloud and the flat 20- and 40-period simple moving averages (SMAs), finding crucial support at the 200-period SMA in the 4-hour chart. The MACD oscillator is ticking lower in the positive region, while the MACD is strengthening its bullish move above its trigger and zero lines. However, the recent outlook in the short-term is neutral as the market fails to create a clear direction. More advances could find resistance at the 1.4205 barrier, ahead [..]

post-image

Technical Analysis – EURJPY retains neutral tone; broader picture bullish  

Posted on June 10, 2021 at 3:09 pm GMT

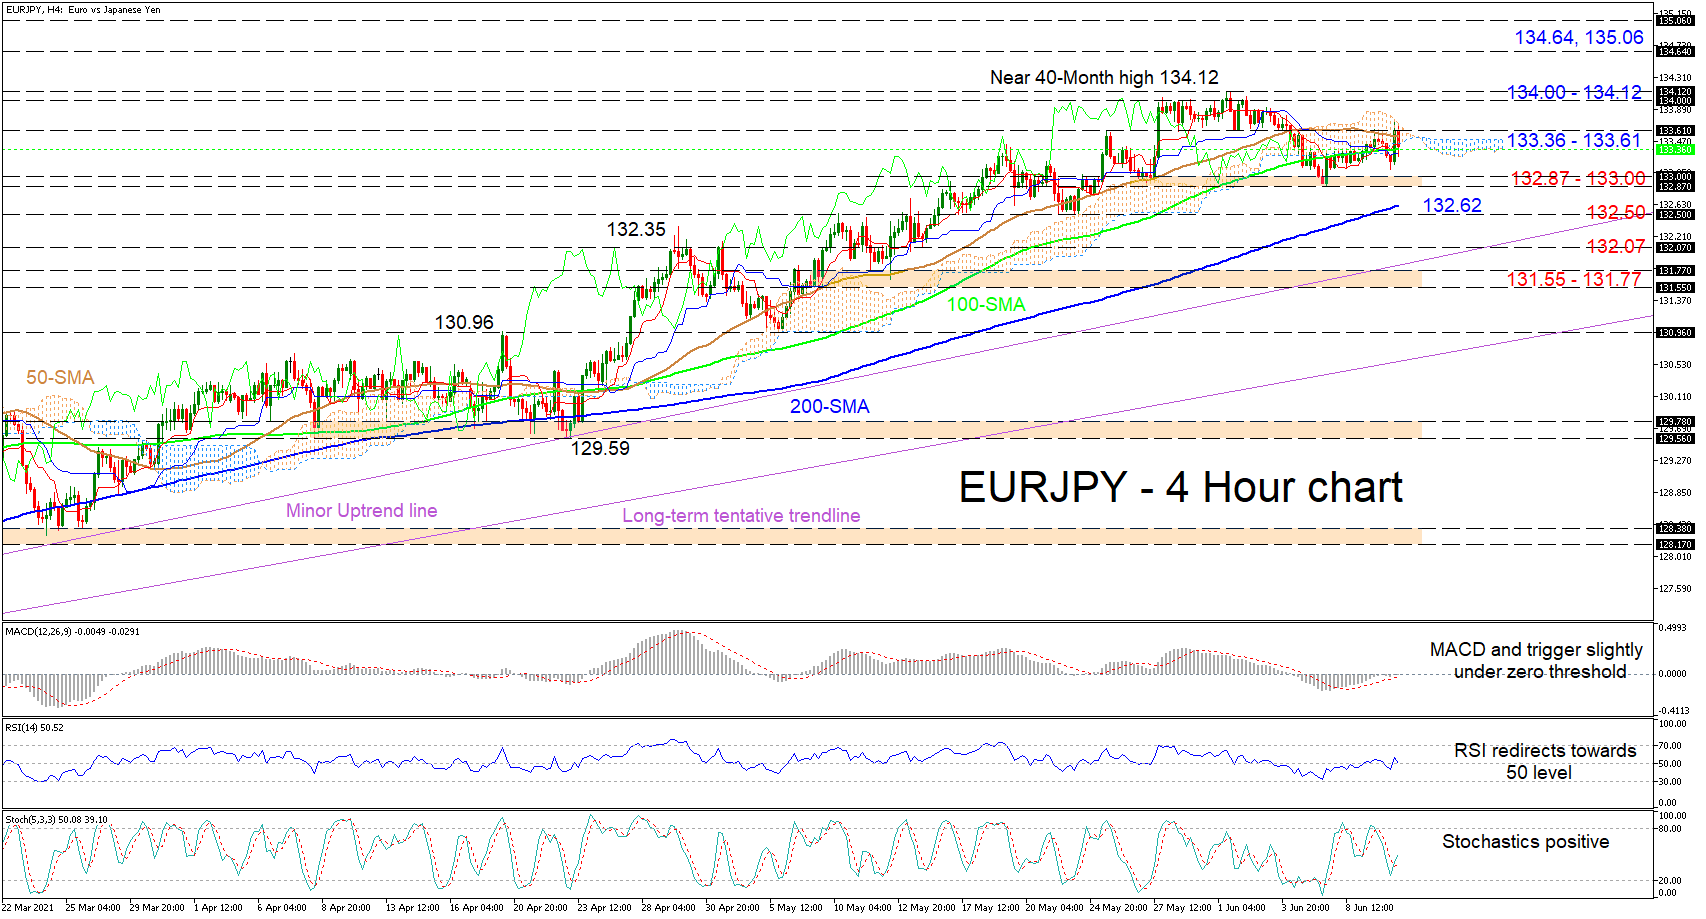
EURJPY is attempting to propel above the Ichimoku cloud after adopting a more sideways trajectory around the 133.36-133.61 zone, following its failed struggle to decisively navigate beyond the 134.00 handle. The shallower incline of the 50- and 100-period simple moving averages (SMAs) is endorsing a pause in price improvements, while the rising 200-period SMA is defending the uptrend. The Ichimoku lines are ever so slightly skewed to the upside, while the short-term oscillators are conveying mixed signals in directional momentum. [..]

post-image

Technical Analysis – Copper seeks protection near 50-SMA; uptrend intact

Posted on June 10, 2021 at 2:55 pm GMT

Copper futures for July delivery cooled to find fresh impetus near the 50-day simple moving average (SMA) once again after their four-week rally topped at a record high of 4.883. The negative momentum in the RSI and the MACD is making the case for another bearish round, squeezing the former below its red signal line and the latter beneath its 50 neutral level. That said, the protective surface of the Ichimoku cloud is nearby, while the 38.2% Fibonacci of the [..]

Technical Analysis – WTI oil futures flatten around 70.00; bullish bias intact

Posted on June 10, 2021 at 9:53 am GMT

WTI oil futures for July delivery are underneath the 70.10 -72.10 key tough resistance area from 2018 for the fourth consecutive day following the break above a bullish ascending triangle. The increasing distance between the red Tenkan-sen and blue Kijun-sen lines and the positive momentum in the MACD raise the odds for additional upside movements in the market. Still, a consolidation phase cannot be ruled out in the near term given the downward reversal in the Stochastics and the stabilization [..]

post-image

Technical Analysis – EURUSD eases below 1.22; 200-period SMA acts as strong support

Posted on June 10, 2021 at 8:46 am GMT

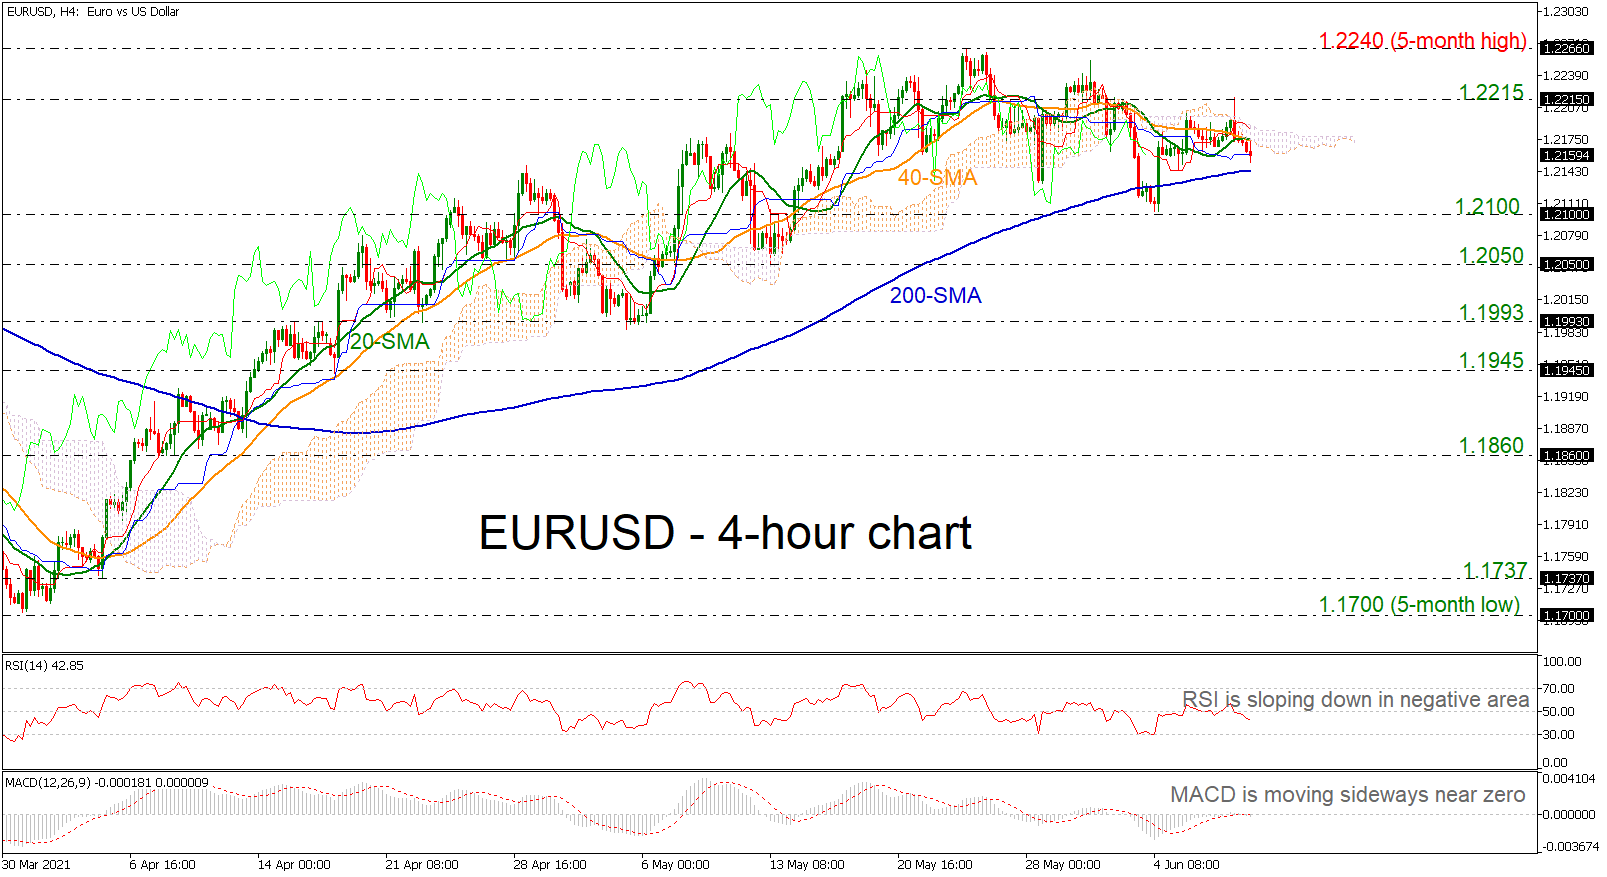
EURUSD is easing in the near-term, creating lower lows and lower highs after the pullback off the five-month high of 1.2240. The MACD oscillator is moving with weak momentum around its zero level; however, the RSI is pointing slightly up in the negative territory. In trend indicators, the price is hovering within the blue Kijun-sen line and the 20- and 40-period simple moving averages (SMAs). If the price dives below the 200-day SMA, which stands near 1.2143, it could take the market towards the [..]

Technical Analysis – AUDUSD lacks convincing drive to alter neutral state

Posted on June 10, 2021 at 8:24 am GMT

AUDUSD is consolidating now for three-months after the correction off the 0.8000 mark, and directional impetus is still absent. The entangled and relatively horizontal 50- and 100-day simple moving averages (SMAs) are reflecting the pair’s muted demeanour, while the 200-day SMA is defending the positive structure. The Ichimoku lines are not specifying any increase in directional momentum, while the short-term oscillators are also transmitting weak and mixed signals in sentiment. The MACD and its red trigger line are marginally holding [..]

Risk Warning: Your capital is at risk. Leveraged products may not be suitable for everyone. Please consider our Risk Disclosure.