XM does not provide services to residents of the United States of America.

Technical Analysis

post-image

Technical Analysis – EURJPY plunges to 132 level around minor uptrend line

Posted on June 17, 2021 at 12:39 pm GMT

EURJPY is residing in the vicinity of the 132.00 handle with sellers flirting with the minor uptrend line, pulled from the 125.08 trough, after negative pressures became dominant below the 200-period simple moving average (SMA). The 100- and 200-period SMAs have yet to endorse a downward price shift, however, the falling 50-period SMA is indicating strong negative forces. The negative tone from the dipping Ichimoku lines and the short-term oscillators remains intact. The MACD is diving underneath its red trigger [..]

post-image

Technical Analysis – EURUSD in broken pieces after FOMC damage

Posted on June 17, 2021 at 9:36 am GMT

EURUSD was one of the biggest victims of the hawkish FOMC policy announcement, with the price collapsing by more than 1.30% below May’s lows in the aftermath and extending its freefall lower to 1.1940 on Friday. An upside reversal would not be a big surprise in the near term in the four-hour chart given the RSI’s deep downfall inside the oversold area. The Stochastics also look set for a bullish cross in the oversold territory, though neither of those indicators have showed [..]

post-image

Technical Analysis – USDCHF progresses as bulls repower off previous candle’s low

Posted on June 17, 2021 at 8:25 am GMT

USDCHF is extending yesterday’s gains, which catapulted the price up from around 0.8990, after having recoiled a tad off 0.9093 – the lower band of the resistance region in hand. The initial thrust of the rally overtook the 200-period simple moving average (SMA) and the 0.9057 level, which happens to be the 23.6% Fibonacci retracement of the down leg from 0.9472 until 0.8925. The upturn in the 50- and 100-period SMAs is positive, while the bullish Ichimoku lines are fortifying [..]

Technical Analysis – WTI futures pull back from 32-month peak

Posted on June 17, 2021 at 7:36 am GMT

WTI futures were in a high-flying condition in the previous days, recording a fresh 32-month peak of 72.81. The price is trading above the support line drawn from the low in April 2020, with the outlook remaining cautiously optimistic. If the bulls can gain control towards the 72.81 top, a significant rally until the inside swing high at 75.24, registered in July 2018, may take place. A break above the aforementioned level could open the door for the next obstacle at 76.87, being the high from September 2018. The [..]

Technical Analysis – AUDUSD fails to escape range trajectory despite plunge

Posted on June 17, 2021 at 6:22 am GMT

AUDUSD tumbled in the wake of the hawkish FOMC policy announcement late on Wednesday, but the bearish wave was not strong enough to violate the 0.7600 level and send the price out of the three-month-old range area. Negative pressures could persist in the short term as the MACD is growing bearish below its signal and zero lines, while the RSI has yet to reach its 30 oversold level despite the harsh drop below its 50 neutral mark. Yet, an upside [..]

post-image

Technical Analysis – GBPJPY consolidates around 155 handle

Posted on June 16, 2021 at 3:20 pm GMT

GBPJPY is currently lacking directional momentum, resting on the 50- and 100-period simple moving averages (SMAs), which are endorsing a more sideways price trajectory. The pair has eased from its near 40-month peak of 156.06, adopting a more stabilized bearing. The Ichimoku lines demonstrate no clear lead in negative or positive drive, while the short-term oscillators are also mixed. The MACD and its red trigger line are barely above the zero mark, while the RSI is flickering minor strength around [..]

post-image

Technical Analysis – EURGBP holds in descending triangle below 0.86

Posted on June 16, 2021 at 10:01 am GMT

EURGBP has been trading in a short-term descending triangle over the last two months with the top border at the 0.8730 resistance and the lower border at the 0.8560 support. The pair is trading below the flat 20- and 40-day simple moving averages (SMAs) and within the Ichimoku cloud. The stochastic is travelling upwards after the positive cross within the %K and %D lines, while the RSI is sliding down just below the 50 level. A penetration of the triangle [..]

post-image

Technical Analysis – Gold discovers foothold and glues to 200-MA

Posted on June 16, 2021 at 8:35 am GMT

Gold has located its footing in the support zone of 1,844-1,852 after steadily fading from the 1,900 vicinity, breaking a tentative uptrend line – pulled from the 1,678 trough – and piercing below the 200-period simple moving average (SMA). The declining slope of the 50-period SMA has somewhat eased and together with the 100-perod SMA, are suggesting the price may adopt a sideways trajectory, at least for a while until a more absolute direction evolves. The flattening blue Kijun-sen line [..]

Technical Analysis – NZDUSD remains neutral above 0.71

Posted on June 16, 2021 at 7:17 am GMT

NZDUSD has been in a sideways move over the last two months with upper boundary the 0.7313 resistance and lower boundary the 0.7100 handle. The price is trading near the aforementioned level, falling beneath the bearish cross within the 20- and 40-day simple moving averages (SMAs). The RSI indicator is diving in the negative territory as well as the MACD oscillator, while the stochastic dropped in the oversold zone. If the price falls below 0.7100, the 200-day SMA will be [..]

post-image

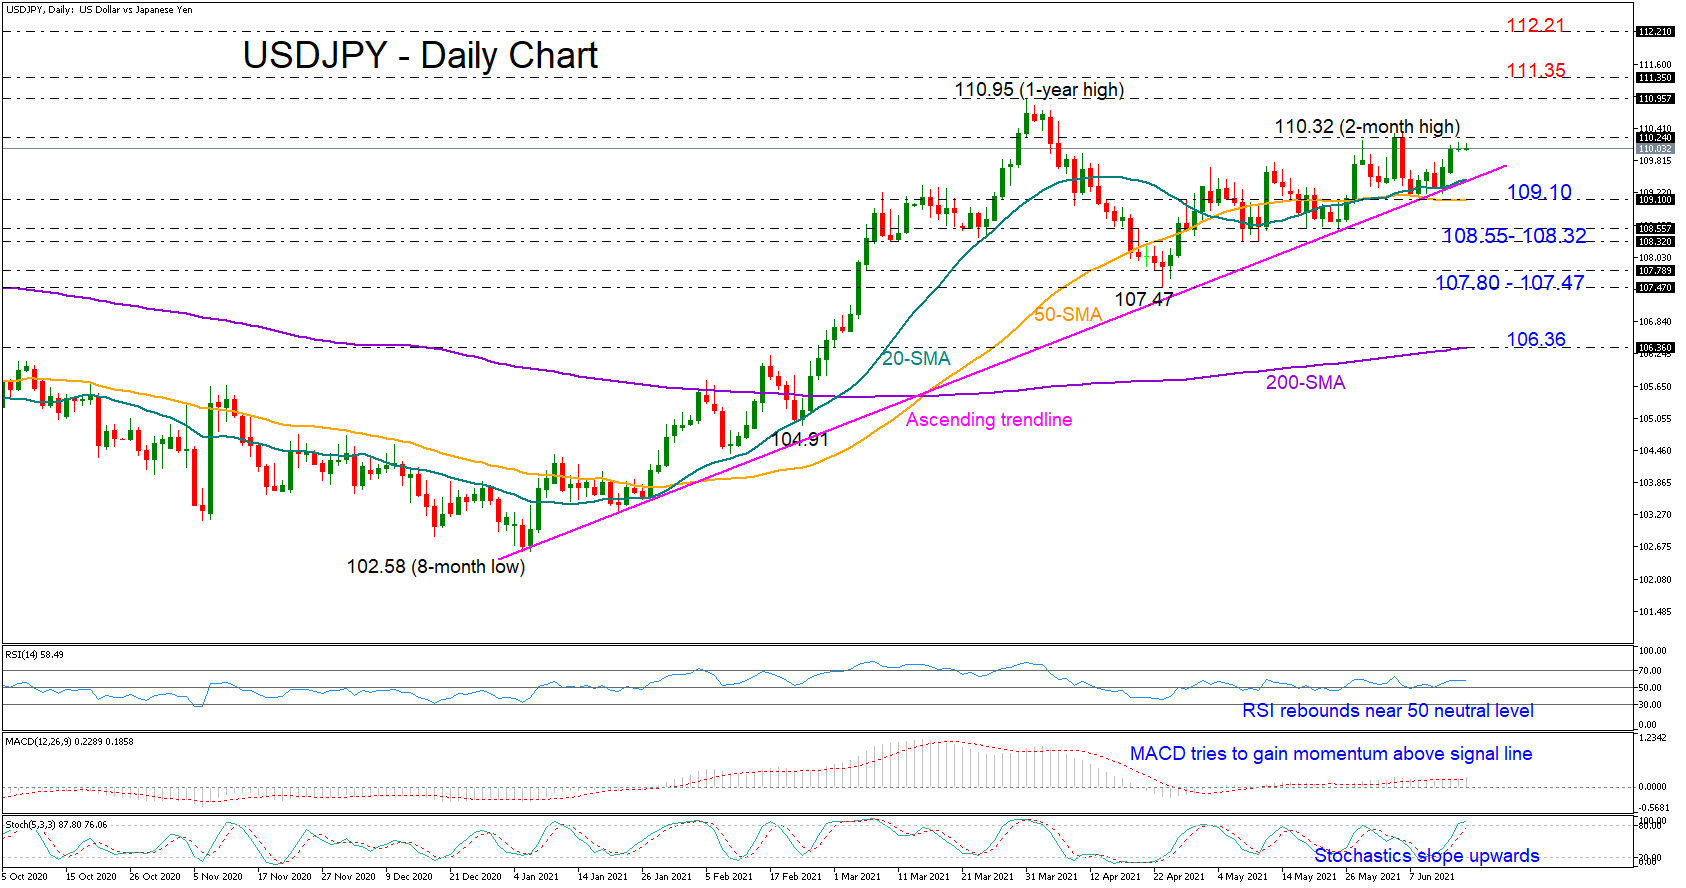
Technical Analysis – USDJPY aims to grow bullish after trendline bounce

Posted on June 16, 2021 at 7:13 am GMT

USDJPY stepped on the 20-day simple moving average (SMA) and the ascending trendline and reversed a large part of the latest pullback from a two-month high of 110.32. Concomitantly, the price managed to add a new higher low to the short-term upward pattern which started in late April, flagging that the bulls remain in play ahead of the FOMC policy announcement today at 18:00 GMT. That said, a decisive close above the 110.32 peak is currently required to boost buying interest towards the [..]

Risk Warning: Your capital is at risk. Leveraged products may not be suitable for everyone. Please consider our Risk Disclosure.