XM does not provide services to residents of the United States of America.

Technical Analysis

post-image

Technical Analysis – EURUSD finds footing near 23.6% Fibo; upside bias weak
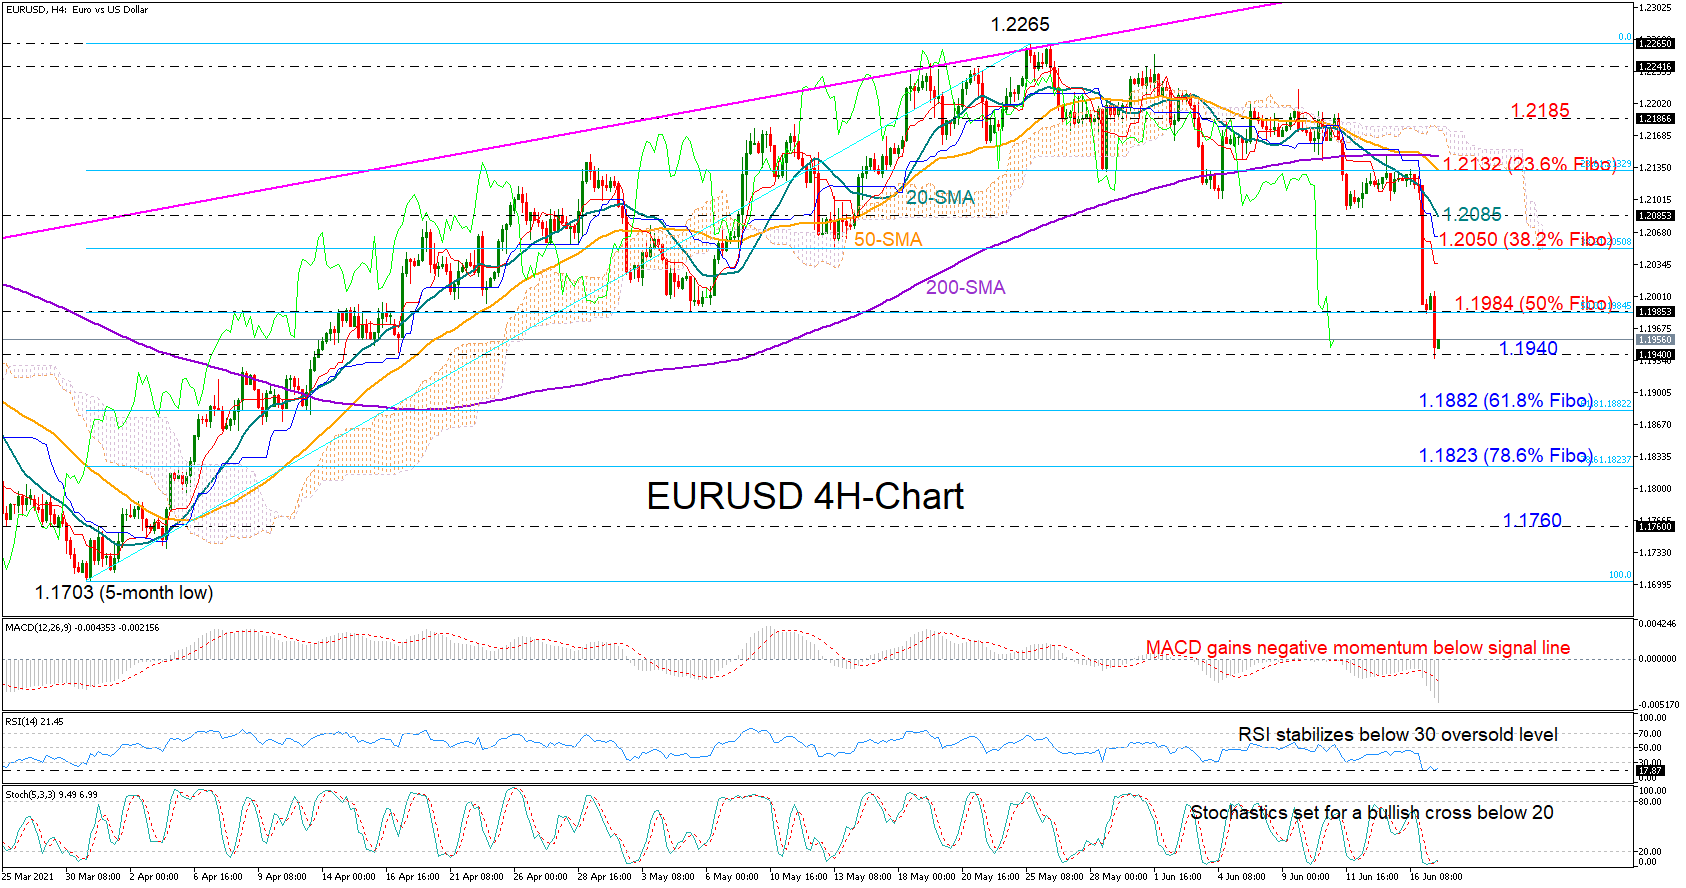
Posted on June 21, 2021 at 6:00 am GMT

EURUSD has steadied slightly above 1.1856, which is the 23.6% Fibonacci retracement of the January-March downleg, following the sharp slide from the 1.21 vicinity last week. However, the upside pressure is extremely weak as momentum indicators remain deep in bearish territory. The MACD histogram has slumped below zero, falling far beneath its red signal line. The stochastics are also buried in the oversold zone below 20 and the %K line is barely ticking higher. However, should it manage to complete [..]

post-image

Technical Analysis – Copper futures gain downside momentum below MAs

Posted on June 18, 2021 at 12:17 pm GMT

Copper futures are steadily plotting lower highs and lows beneath the simple moving averages (SMAs), whose bearish demeanours are underpinning the negative price action. The falling Ichimoku lines are signalling that downside momentum is gaining pace, while the short-term oscillators are suggesting that negative pressures are taking a breather. The MACD, far below zero, has flattened underneath its red trigger line, while the RSI is hovering marginally above the 30 level. The recently acquired positive charge in the stochastic oscillator [..]

post-image

Technical Analysis – NZDUSD reverses up after steep slide

Posted on June 18, 2021 at 10:27 am GMT

NZDUSD is reversing quickly to the upside after the sharp plummet towards a fresh two-and-a-half-month low of 0.6960 earlier today. The RSI is flattening in the oversold territory; however, the stochastic is ticking higher after the drop into the negative zone. The Ichimoku indicator is signaling more losses in the market, so are the 20- and 40-period simple moving averages (SMAs). In case of more bullish actions, immediate resistance could come from the 0.7015 barrier before moving towards the red Tenkan-sen line and the blue Kijun-sen [..]

post-image

Technical Analysis – GBPUSD seeks out an edge to break its fall

Posted on June 18, 2021 at 7:42 am GMT

GBPUSD continues to freefall from the 1.4100 area and far below the 200-period simple moving average (SMA), as the after-effects of Wednesday’s hawkish FOMC meeting seem to be lingering. The rolling 50- and 100-period SMAs are reinforcing the drop in the pair, which would be confirmed by a negative crossover of the 200-period SMA by the 100-period SMA. The diving Ichimoku lines and the short-term oscillators are demonstrating that negative momentum is growing. The MACD, far below zero, is falling [..]

Technical Analysis – USDCAD marks best week for 2021; rally slows near familiar resistance

Posted on June 18, 2021 at 7:41 am GMT

USDCAD had its most constructive week since March 2020, rallying by 1.7% to a seven-week high of 1.2382. The bull run has snapped the one-month-old trading range and sent the price above its 20- and 50-day simple moving averages (SMAs), but a familiar heavy obstacle is currently threatening to put breaks on the rally. Particularly, the long-term resistance trendline and the surface of the Ichimoku cloud, which have been limiting upside movements over the past eight months, could captivate the pair below the 1.2400 level and within [..]

Technical Analysis – GBPJPY tumbles with strong momentum below 153.00

Posted on June 18, 2021 at 7:24 am GMT

GBPJPY plunged to a new one-month low of 152.89 today, falling below the 20- and 40-day simple moving averages (SMAs) in the short-term. The MACD and the RSI indicators continue to signal a downward move, while the stochastic posted a bearish crossover within the %K and %D lines. If selling efforts moderate below the 40-day SMA, the next support would be at the 152.45-153.40 area, before tumbling to the 23.6% Fibonacci retracement level of the upward move from 129.30 to [..]

post-image

Technical Analysis – JP 225 index finds footing after yesterday’s strong pullback

Posted on June 17, 2021 at 3:13 pm GMT

The Japan 225 index (Cash) has improved marginally above the 50-period simple moving average (SMA) and is now tackling the converged Ichimoku lines around 29,168. The SMA’s bullish demeanours have yet to evaporate, which is positive for the upside outlook. The price bounce within the support region between the 28,920 level and the 28,831 low, the former being the 23.6% Fibonacci retracement of the up leg from 27,131 until 29,424, recouped lost ground but the positive drive seems to have [..]

post-image

Technical Analysis – US 30 index retreats below SMAs in short-term

Posted on June 17, 2021 at 1:04 pm GMT

The US 30 (Cash) index posted a negative correction movement after it topped at 34,881 in the beginning of the month. The price also declined below the 20- and 40-day simple moving averages (SMAs) and is holding in the Ichimoku cloud. The RSI is falling beneath the 50 level and the stochastic is flirting with the oversold territory. More losses might push the price down to the 33,267 barrier, before crashing to 32,080. Underneath these obstacles, the 23.6% Fibonacci retracement level of the [..]

post-image

Technical Analysis – EURJPY plunges to 132 level around minor uptrend line

Posted on June 17, 2021 at 12:39 pm GMT

EURJPY is residing in the vicinity of the 132.00 handle with sellers flirting with the minor uptrend line, pulled from the 125.08 trough, after negative pressures became dominant below the 200-period simple moving average (SMA). The 100- and 200-period SMAs have yet to endorse a downward price shift, however, the falling 50-period SMA is indicating strong negative forces. The negative tone from the dipping Ichimoku lines and the short-term oscillators remains intact. The MACD is diving underneath its red trigger [..]

post-image

Technical Analysis – EURUSD in broken pieces after FOMC damage

Posted on June 17, 2021 at 9:36 am GMT

EURUSD was one of the biggest victims of the hawkish FOMC policy announcement, with the price collapsing by more than 1.30% below May’s lows in the aftermath and extending its freefall lower to 1.1940 on Friday. An upside reversal would not be a big surprise in the near term in the four-hour chart given the RSI’s deep downfall inside the oversold area. The Stochastics also look set for a bullish cross in the oversold territory, though neither of those indicators have showed [..]

Risk Warning: Your capital is at risk. Leveraged products may not be suitable for everyone. Please consider our Risk Disclosure.