XM does not provide services to residents of the United States of America.

Technical Analysis

Technical Analysis – GBPJPY eases from 155 mark but upside risks remain intact

Posted on June 25, 2021 at 9:12 am GMT

GBPJPY’s latest rally off the 100-day simple moving average (SMA) has failed to decisively close above the 155.00 handle, an area where the recent bearish price correction was previously initiated. This fresh price bounce at 151.30 is validating that the SMAs are shielding the positive structure. The Ichimoku lines are indicating subdued positive momentum, which has yet to gain a clear lead, while the short-term oscillators are suggesting that bullish impetus is struggling. Barely above zero are the MACD and [..]

Technical Analysis – USDCAD eases to around 1.2300; back to bearish bias

Posted on June 25, 2021 at 6:50 am GMT

USDCAD is posting losses again after finding resistance at the 1.2490 barrier, inserting in the Ichimoku cloud. The RSI is ticking lower in the positive region, while the MACD is moving south in the bullish territory, confirming the recent downside movement. However, the 20- and 40-day simple moving averages (SMAs) created a bullish cross. If the price moves lower and penetrates the 1.2200 handle, it would hit the short-term SMAs at 1.2180 before flirting with the six-year low of 1.2012. Underneath these levels, the [..]

post-image

Technical Analysis – EURJPY’s rally stalls beneath 200-MA

Posted on June 24, 2021 at 4:13 pm GMT

EURJPY has managed to recoup a good portion of lost ground from a price correction, which aggressively plunged from the 200-period simple moving average (SMA) until the 130.00 mark. The bearish SMAs are currently delaying the price from extending upside momentum. The short-term oscillators retain a slight positive tilt, however; positive momentum remains feeble at the moment. The MACD has flattened above its red trigger line in the positive zone, while the RSI is persisting in bullish territory. The stochastic [..]

post-image

Technical Analysis – Silver finds shelter around 200-SMA after sharp decline

Posted on June 24, 2021 at 12:54 pm GMT

Silver is exposed to additional downside corrections following last week’s crash below the long-term ascending trendline. The 200-day simple moving average (SMA), however, which has been blocking the way to the downside this week at 25.70, could provide another opportunity to the bulls if it holds firm. The RSI and the Stochastics signal that the market has reached oversold conditions, and some recovery is possible as the indicators are sloping upwards again. The MACD has also slowed down in the [..]

post-image

Technical Analysis – USDCHF is back in red after surpassing 20-SMA

Posted on June 24, 2021 at 12:21 pm GMT

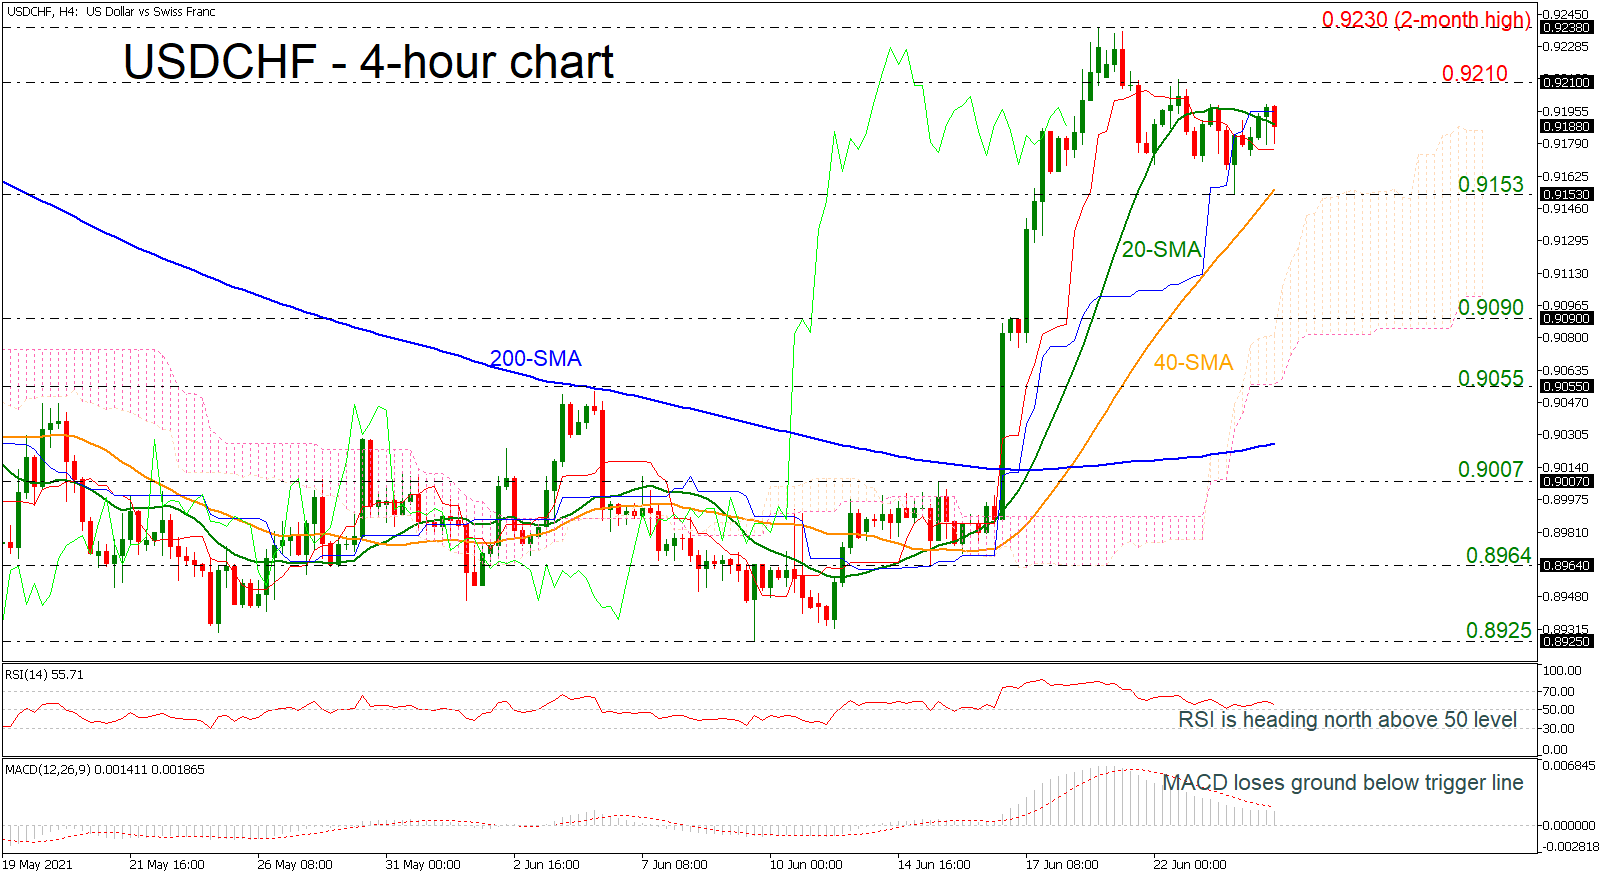
USDCHF has reversed back up again after finding support at the 0.9153 barrier, surpassing the 20-period simple moving average (SMA) in the 4-hour chart. However, the price is currently posting a red session. Momentum indicators are pointing to a neutral to negative bias in the short term with the RSI just above the neutral threshold of 50 and the MACD losing momentum below its trigger line in the bullish territory. In the event of upside movements, the 0.9210 level could [..]

post-image

Technical Analysis – EURUSD turns up above 1.1900 in near term

Posted on June 24, 2021 at 8:26 am GMT

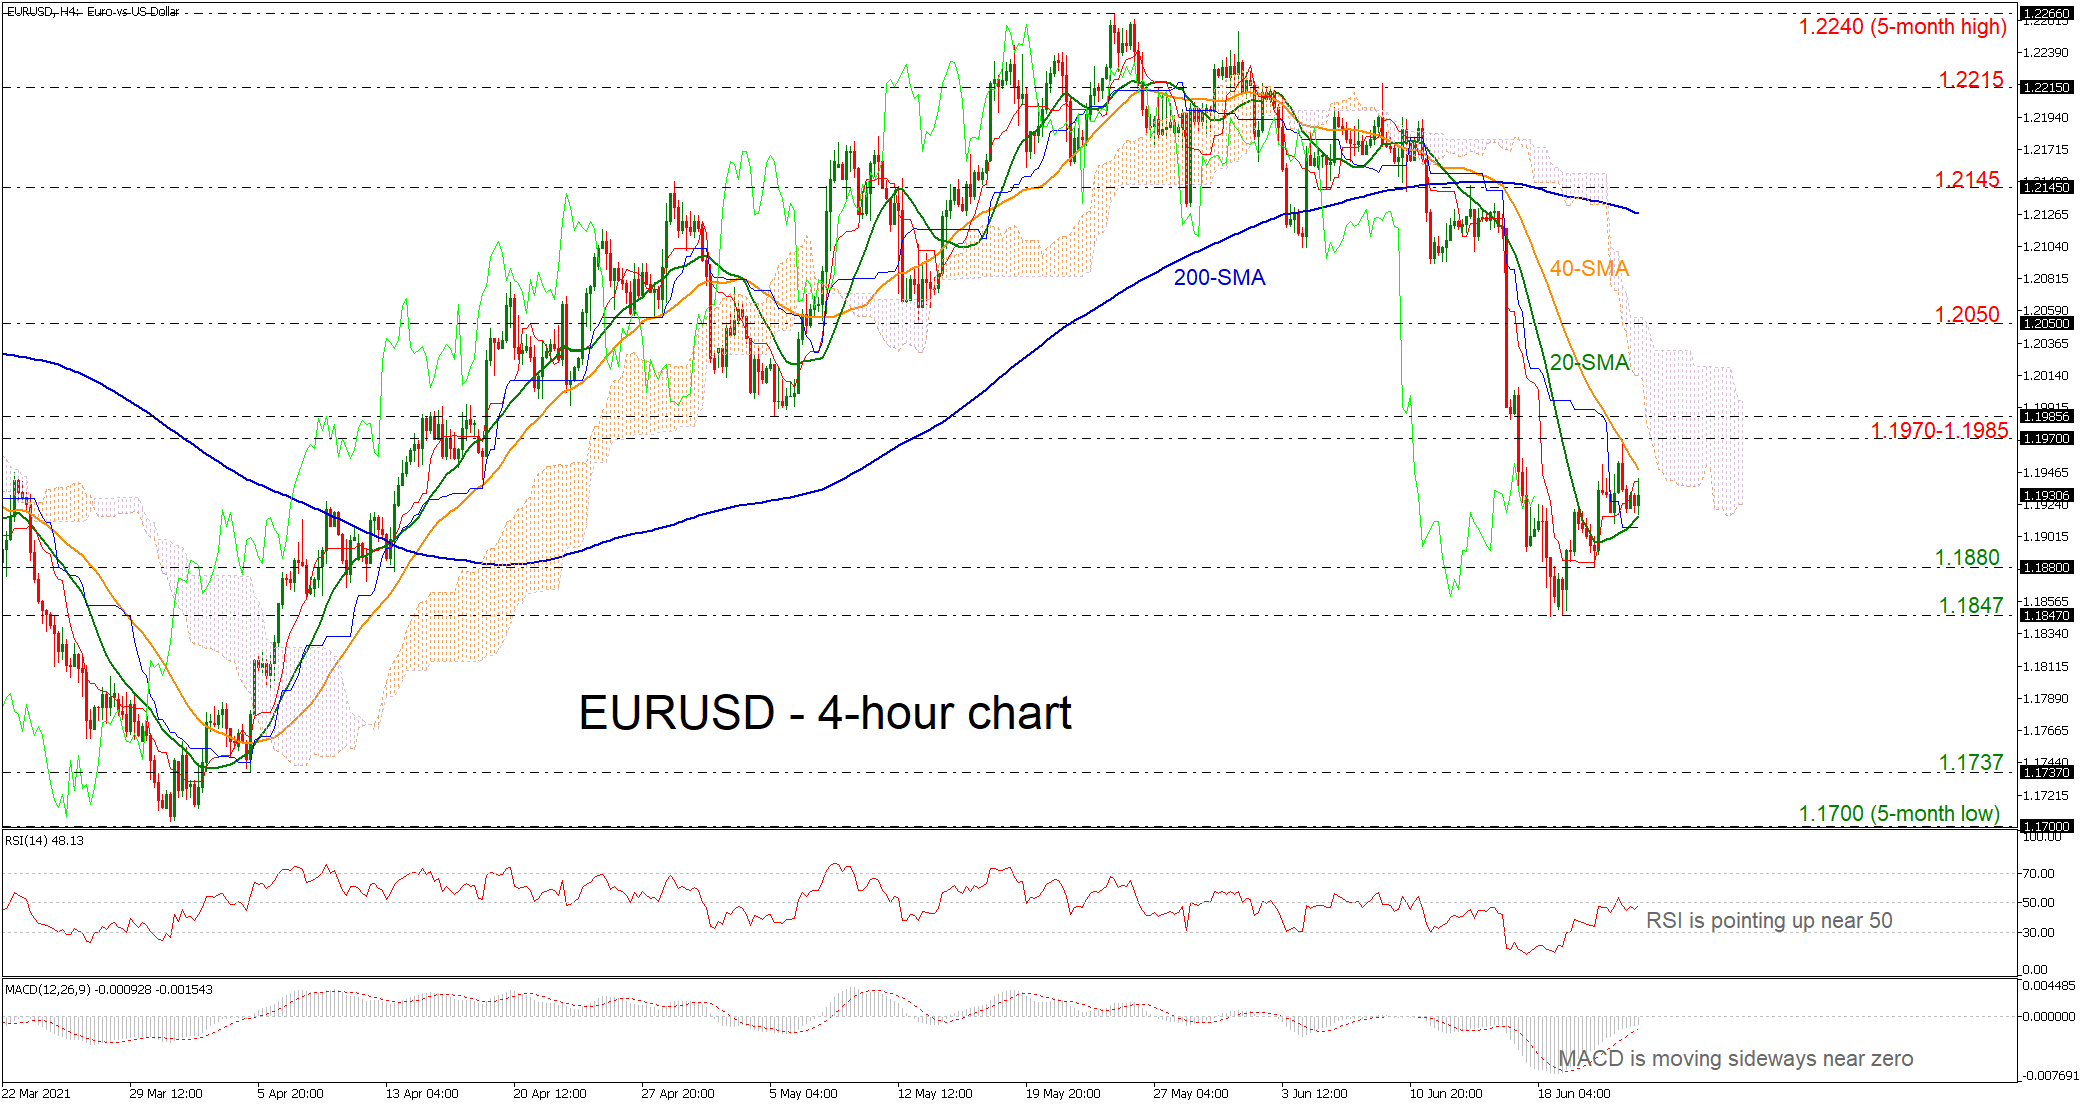
EURUSD has been in a bullish correction move over the last week after the sell-off from the five-month high of 1.2240. The pair is currently trading within the 20- and 40-period simple moving averages (SMAs) and the red Tenkan-sen line is standing above the blue Kijun-sen line, suggesting a bullish tendency in the 4-hour chart. If the market rises over the 40-period SMA, it might reach the 1.1970-1.1985 resistance area before hitting the 1.2050 barrier. The 200-period SMA at 1.2127, [..]

Technical Analysis – WTI futures’ upside trajectory shows no signs of abating

Posted on June 24, 2021 at 8:14 am GMT

WTI oil futures’ positive drive has somewhat lost its potency, after logging a 32½-month high of 74.23 despite prevailing bullish forces. The climbing simple moving averages (SMAs) are safeguarding the uptrend, while the rising Ichimoku lines are endorsing additional price gains. The short-term oscillators are reflecting a slight pause in positive directional momentum. The MACD has sneaked ever so slightly above its red trigger line, while the RSI is persisting above the 70 level. The stochastic oscillator is currently in [..]

Technical Analysis – AUDUSD crawls above 200-SMA but eyes remain on 0.7600

Posted on June 24, 2021 at 6:39 am GMT

AUDUSD has been on a recovery mode this week, slowly erasing the slump to an eight-month low of 0.7476, which shot the price out of the 0.7531 – 0.8006 range area and put the market in a soft downward path. The pair is currently aiming to extend its positive momentum above the 200-day simple moving average (SMA), with the RSI and the Stochastics backing the bullish attempt as the indicators are sloping upwards again after hitting a bottom in the oversold [..]

post-image

Technical Analysis – EURCHF eases slightly but positive drive intact

Posted on June 23, 2021 at 4:08 pm GMT

EURCHF is struggling to reach the upper boundary of the bearish channel as the 1.0963-1.0978 resistance section is impeding price gains. Positive momentum has yet to fully evaporate as the price is holding above the simple moving averages (SMAs). The rising 50-period SMA is looking set on completing a bullish crossover of the 100-period SMA, which would be a boosting dose to near-term price action. Additionally, the Ichimoku lines have yet to signal serious waning in positive impetus. However, the [..]

post-image

Technical Analysis – Gold ranges below 1,800 while downside risks endure   

Posted on June 23, 2021 at 2:29 pm GMT

Gold is consolidating around its red Tenkan-sen line after aggressively taking a downturn from its 200-period simple moving average (SMA), and finally constructing some footing just shy of the April 29 trough of 1,756. The falling 50- and 100-period SMAs, and their recent bearish crossovers of the 200-period SMA, are enhancing negative pressures. The recently adopted horizontal bearing of the red Tenkan-sen line is suggesting downside powers have eased, while the falling blue Kijun-sen is defending negative forces. That said, [..]

Risk Warning: Your capital is at risk. Leveraged products may not be suitable for everyone. Please consider our Risk Disclosure.